Google Sheets has provided several ways to illustrate and represent data which helps you interpret and understand the variables and their relationships.
This is done with the use of charts and graphs. Amongst these charts is the box plot. In this quick tutorial, we would learn what a box and whisker plot is and how it is created in Google Sheets.
What is a Box and Whisker Plot?
A box and whisker plot, commonly referred to as a box plot, is a chart that shows the relationship and distance between the five-number summary of your dataset.
The five-number summary is the key-value required to build a box and whisker plot.
The five-number summary is made up of five values which are:
- Minimum
- Lower Quartile
- Median
- Upper Quartile
- Maximum.
What is a Google Sheets Box and Whisker Plot Used For?
The box and whisker plot is used for all sorts of data representations but is mostly employed for data exploratory analysis. This is because it shows the five key values and their relationship with each other.
It is also used to compare the variables across a selected measure. It helps to tell whether these variables are closely related or widely spread apart in a given dataset.
How To Make A Box and Whisker Plot in Google Sheets.
Now that you understand the basic concept of a box plot, we want to learn how to create a box plot.
In Google Sheets, the box plot chart type isn’t included in the available charts for presentations. But, we can use the Candlestick Chart to create a box and whisker plot in Google Sheets.
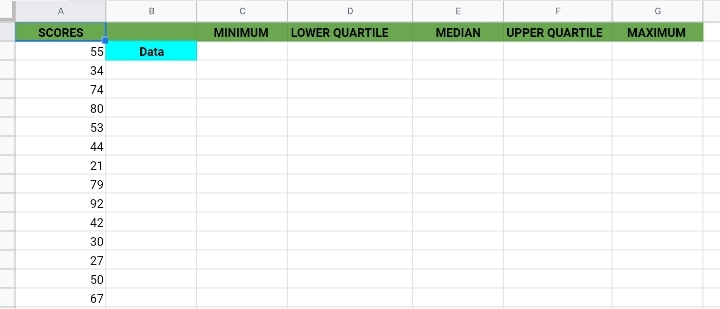
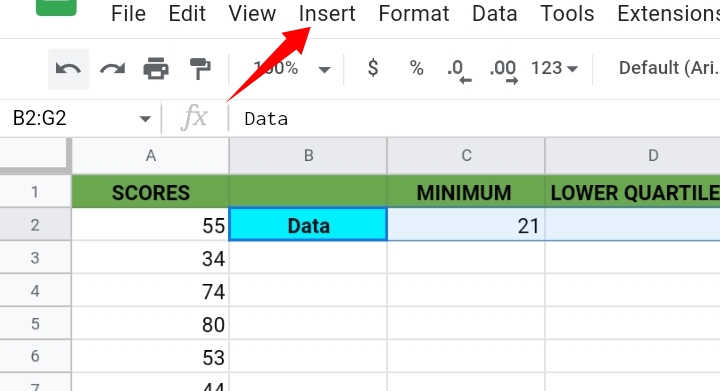
Before we create a box plot, we have to prepare our dataset. In the sample worksheet below, I have some numerical values in column A.
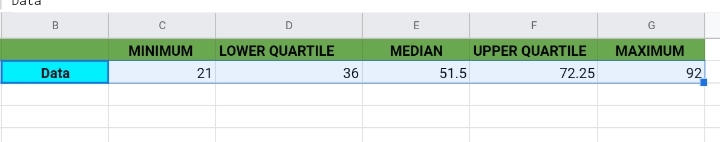
I’ve labeled the headers of columns C, D, E, F and G as Minimum, Lower Quartile, Median, Upper Quartile and Maximum, respectively.
Now we’ll have to find the actual values of the five-number summary.
MINIMUM VALUE
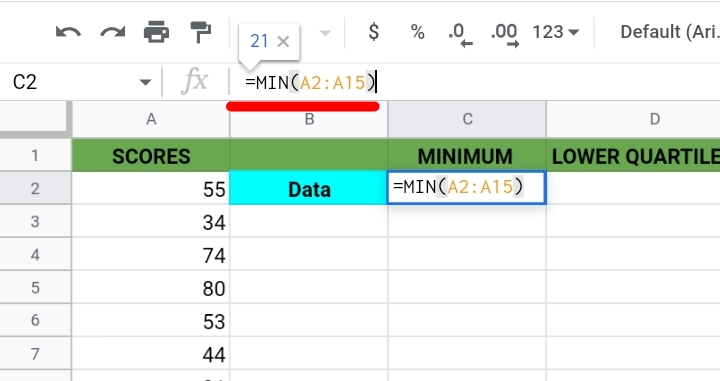
This is the first value amongst the five-number summary. As the title implies, it is the smallest number in the range of values. In my worksheet here, it is placed in column C.
To find the minimum value, we make use of the MIN function. Input the formula, =MIN(A2:A15) into cell C2 and hit the enter key.
The smallest value in the cell range is returned.
LOWER QUARTILE
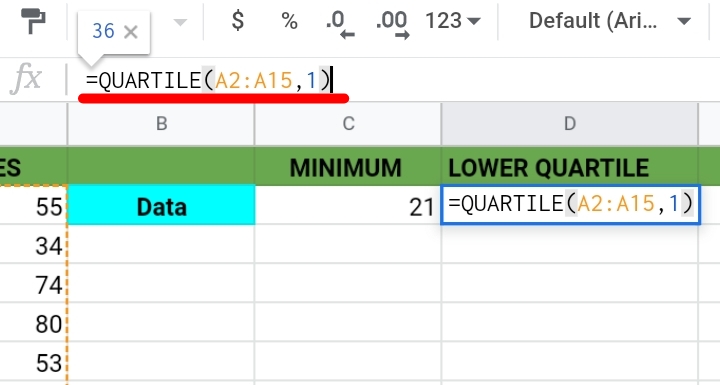
The lower Quartile, also known as the First Quartile is the value in the middle of the first quartile of the dataset. In my worksheet here, it is placed in column D.
To get the value, we make use of the QUARTILE function. Input the formula, =QUARTILE(A2:A15,1) into cell D2 and hit the enter key.
The lower quartile in the cell range is returned.
MEDIAN
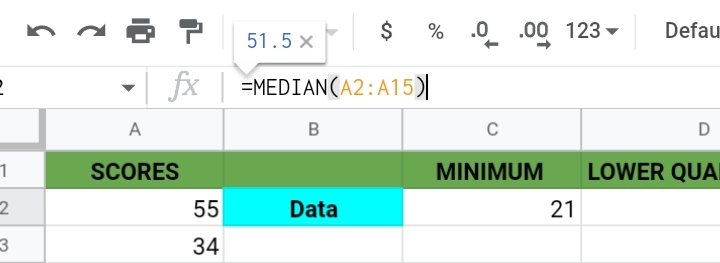
This is the value positioned at the exact center of the dataset. In my worksheet here, it is placed in column E.
To get its value, the MEDIAN function is used. Input the formula =MEDIAN(A2:A15) in cell E2 and hit the enter key.
The median of the dataset is returned.
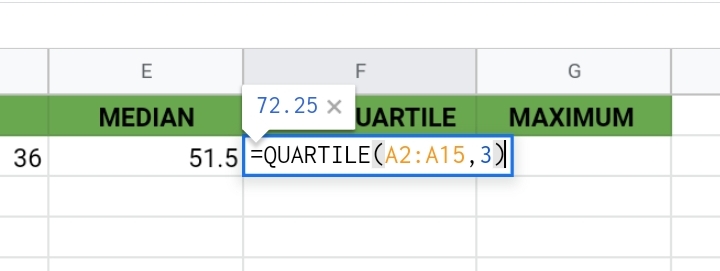
UPPER QUARTILE
Upper Quartile, otherwise known as the Third Quartile, is the value positioned in the middle of the last quartile of the dataset. In my worksheet here, it is placed in column F.
To get its value, the QUARTILE function is used. The only difference in its formula is that we represent the second parameter in the formula as 3.
Input its formula, =QUARTILE(A2:A15, 3) in cell F2. Press the Enter key and the upper quartile in the dataset is returned.
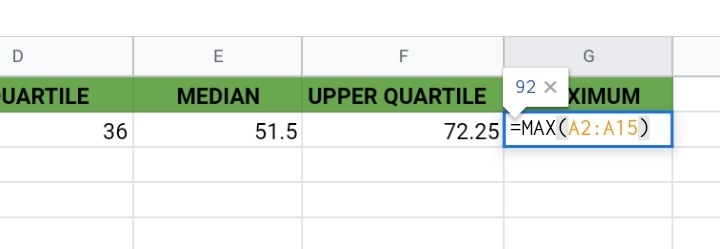
MAXIMUM VALUE
This is the largest number in the dataset. In my worksheet here, it is placed in column G.
To get its value, we use the MAX function.
Input the formula =MAX(A2:A15) in cell G2. Press the Enter key and the largest number in the dataset is returned.
Now that we have found the values of each component, let’s plot the box and whisker plot.
The data has been prepared successfully. We need to create a candlestick chart to illustrate the data.
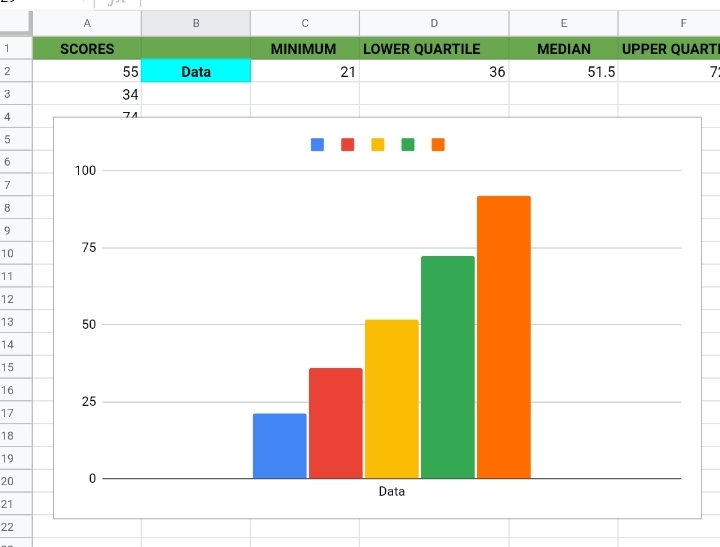
1. Select only the cell range of the five-number summary on the worksheet. I also included the text ‘Data’ in cell B2 which would be used as a header on the box plot.
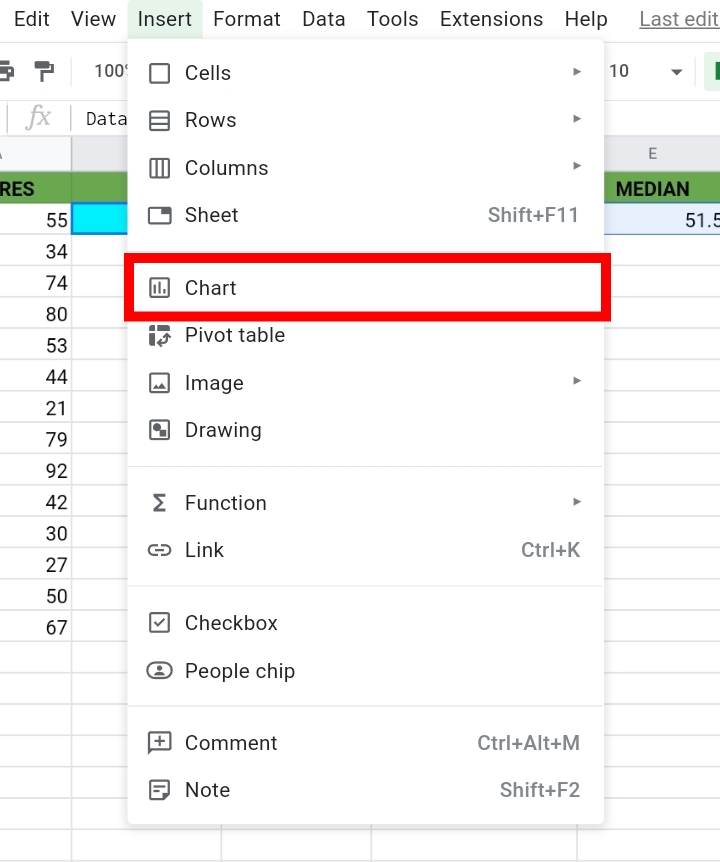
2. Click on Insert on the toolbar.
3. Click on Chart.
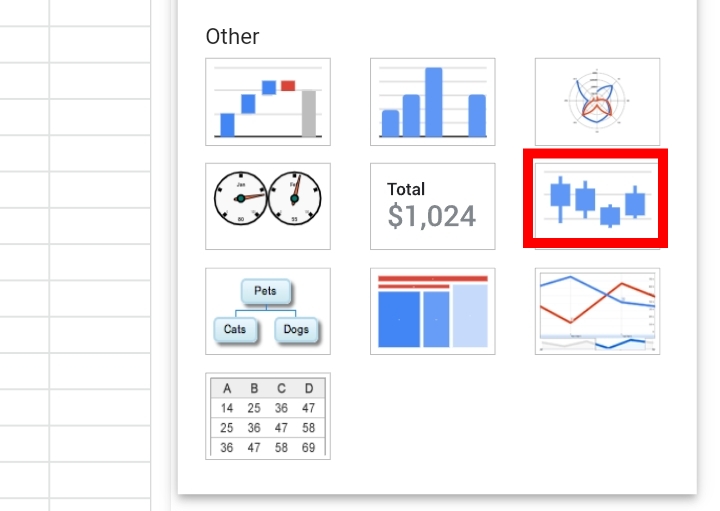
4. Google Sheets guesses the kind of chart you need and automatically produces a Candlestick chart. Google sheets might create a Column chart.
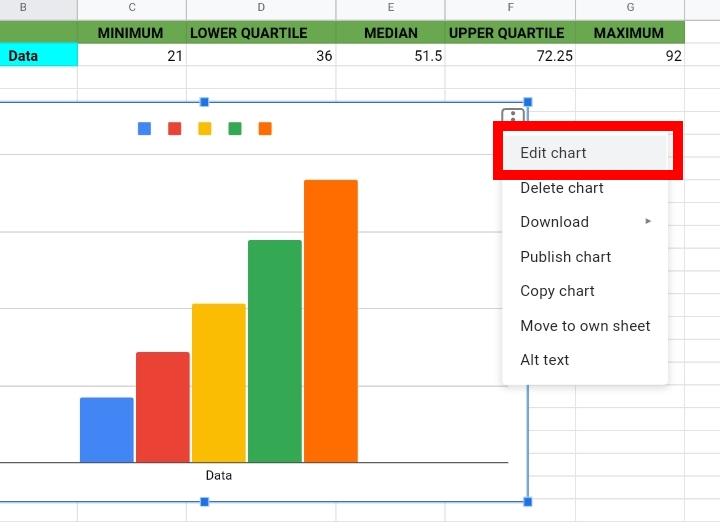
If it does, click on the three dots on the top right of the chart. Click Edit chart.
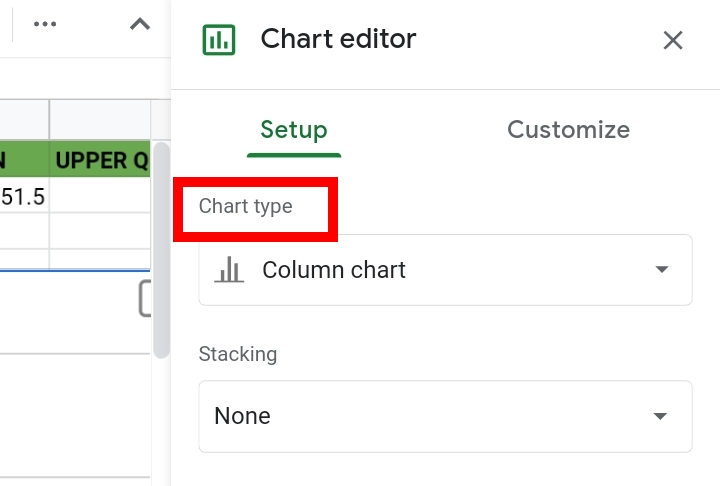
A new tab titled Chart Editor is opened on the right side of the worksheet. Under Setup, click on Chart type and select the candlestick chart.
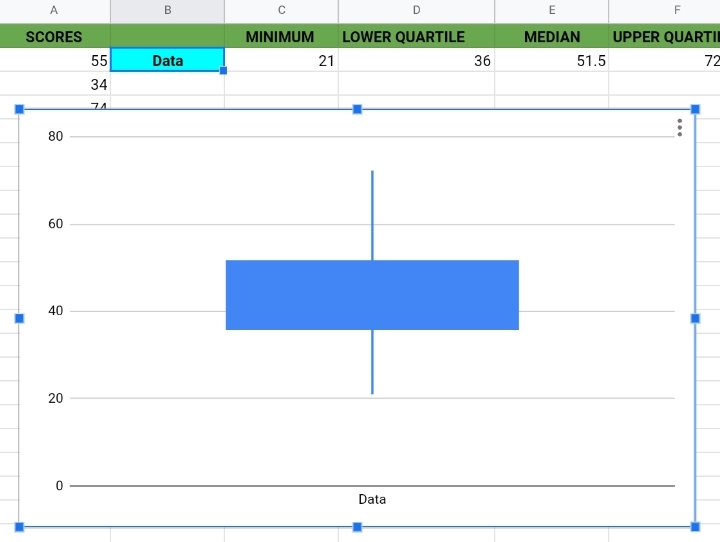
Now, you’ve successfully created a box and whisker plot.
You can also print this chart. Check out this article to do that.
Interpreting the Google Sheets Box and Whisker Plot
It’s great that you’ve created a box plot but do you understand what it means? In this section, I’ll interpret the plot’s values and features.
- The top wicks indicate the maximum value.
- The length of the top wicks indicates the distance between the maximum value from the upper quartile.
- The top head of the box indicates the upper quartile.
- The bottom whiskers indicate the minimum value.
- The bottom head of the box indicates the lower quartile.
- The length of the bottom whiskers indicates the distance between the minimum value from the lower quartile.
The median is not displayed in the box plot, but since we know the exact value, we can manually locate it in the plot.
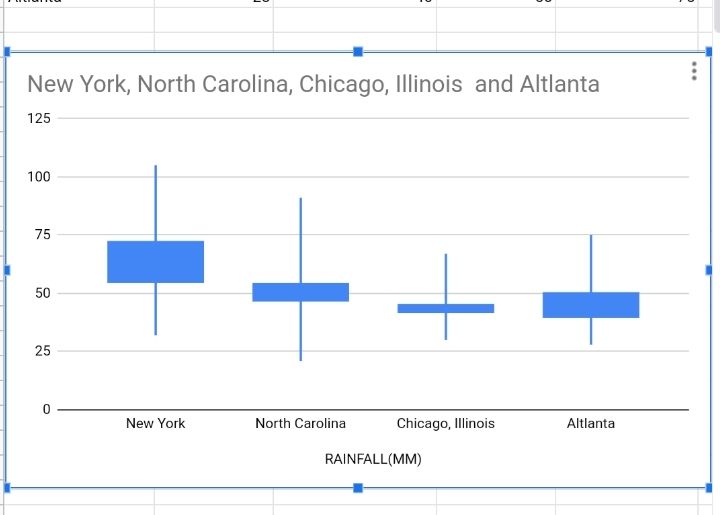
Making Multiple Box and Whisker Charts at Once
Sometimes, you may have multiple values that are components of the five-number summary in a single worksheet. For instance, the sample worksheet below.
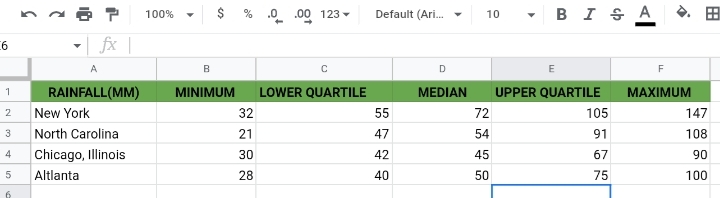
This won’t affect your box plot negatively. There would be multiple candlesticks in your Box and Whisker plot.
When making your box plot, you can follow the steps stated earlier. Note that you must select the entire dataset with the headers.
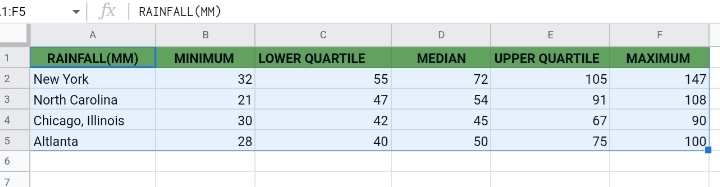
The final result would look like this:
Final Thoughts
The box plot is another helpful chart that would assist you with your daily spreadsheet tasks and analysis.
I hope you learned a thing or two from this article.


