When you hear the word “quartile”, quarter or parts of four always come to mind. Quartiles are defined as any of the three points that divide an ordered distribution into four parts each containing one quartile of the scores. This means that quartiles are made up of three parts which are
● The median.
● The interval mark between the smallest number and the median.
● The interval between the median and the largest number.
Five digits are used for calculating the quartile of a dataset and they are 0, 1, 2, 3 and 4. In this tutorial, we would show you how to calculate quartiles under some topics and processes.
Quartile Function Syntax for Google Sheets.
The syntax function or formula for quartile in Google sheets is
=QUARTILE(data, quartile_number)
Where: data means the selected range of data in the worksheet.
Quartile number means the quartile value from 0 to 4.
- 0 returns the minimum value in the range selected.
- 1 represents the returned data nearest to the first quartile.
- 2 represents the second quartile which returns data nearest to the median.
- 3 represents the returned data nearest to the third quartile.
- 4 represents the fourth quartile. It returns the maximum value in the range.
How To Find Quartiles In Google Sheets – Easy Steps
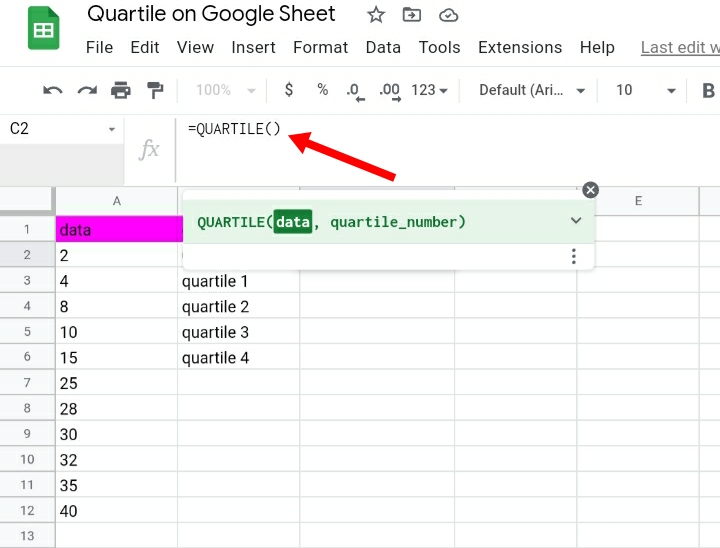
Using the above quartile function syntax, we would be solving quartiles on the worksheet below. The worksheet comprises a set of numbers in column A. In column B, we have 0, 1, 2, 3, and 4 written in quartiles while column C represents the quartile results.
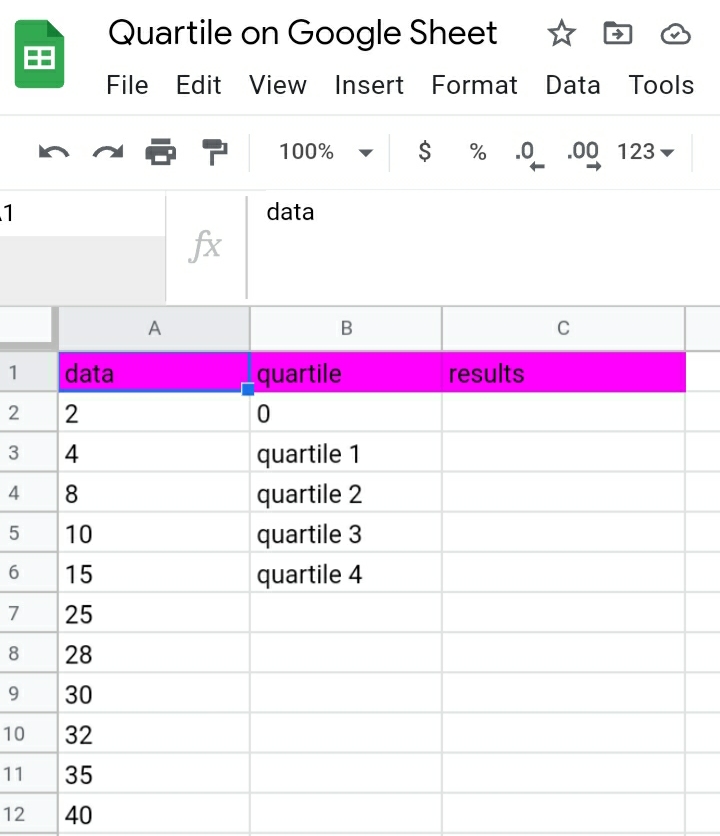
Step 1: Input the syntax formula =QUARTILE(data, quartile_number) in the result column C, row two.
In B2 where the quartile is zero, the result is equal to the original data which is two. In the next row B3, where the selected range is A2:A12 and the quartile number is 1.
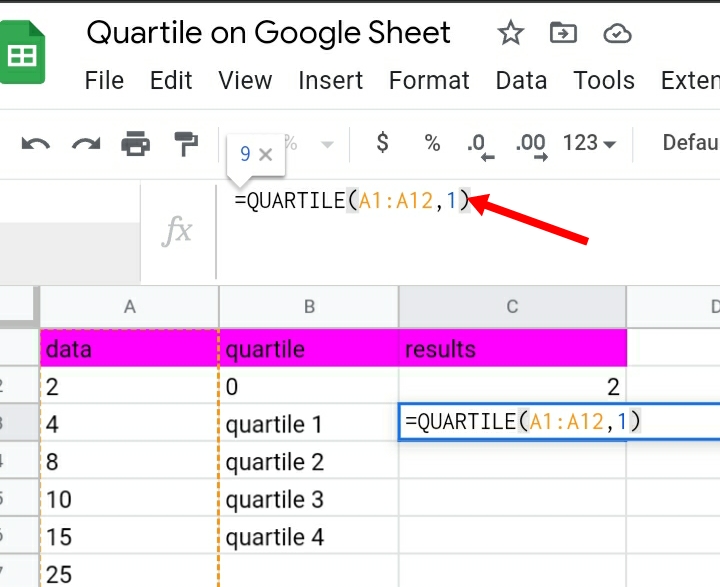
Step 2: Click Enter. It would provide a quartile result in column C.
Step 3: Input the formulas in each row in column C, substituting the quartile numbers as 1, 2, 3, and 4. It provides each quartile mark for the dataset.
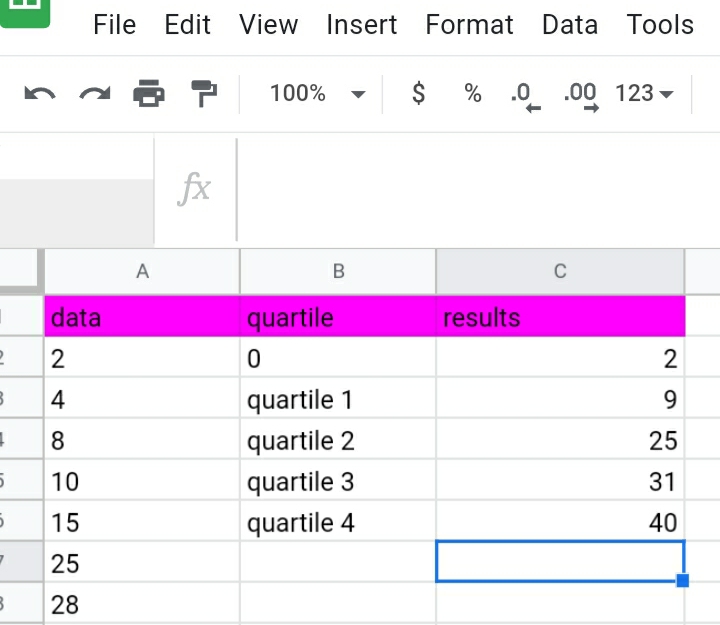
Alternative Way:
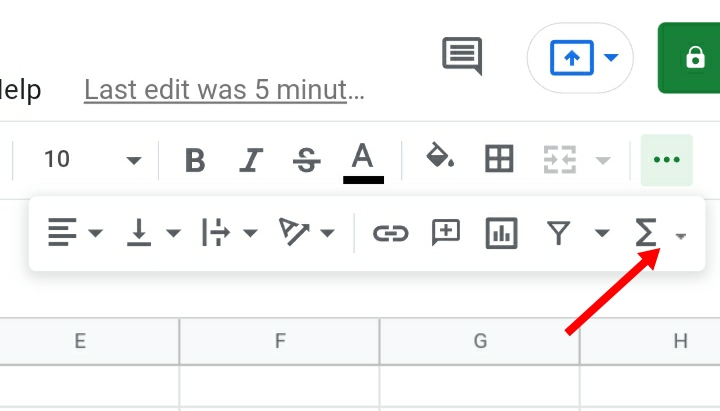
Step 1: Using the toolbar above your worksheet, click on the three dots arranged horizontally.
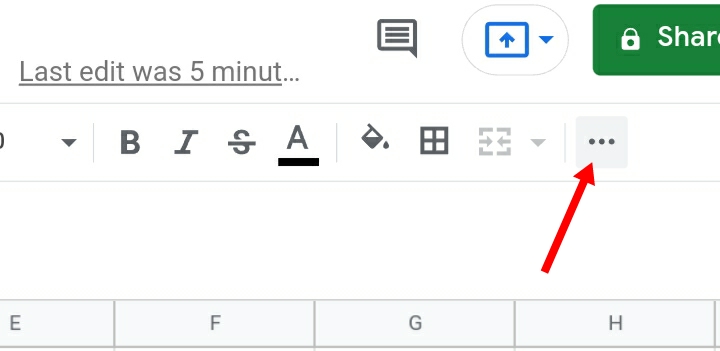
Step 2: A list of symbols appear, click on the Σ (sigma) icon.
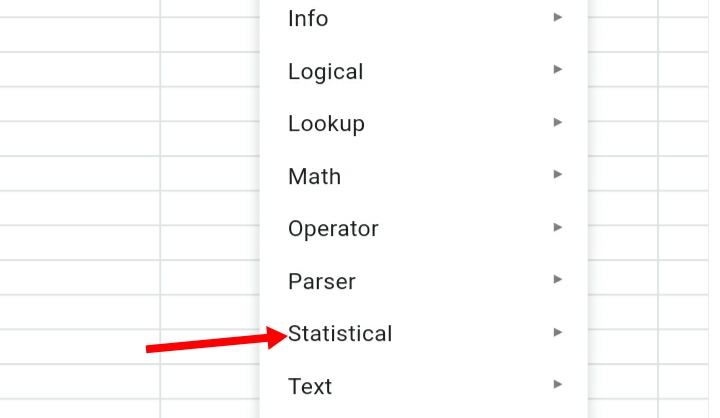
Step 3: It provides a list of functions that can be used in different aspects of calculations. Click on Statistical.
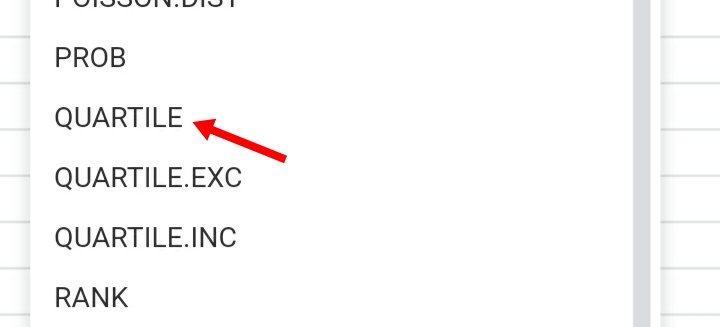
Step 4: A long list of functions is displayed on the right side of your worksheet. Search and click on Quartile.
Step 5: Input the range of the selected data in column A (A2:A12) and the quartile number 0 in B2.
Step 6: Click Enter. A quartile mark is produced in column C.
Check out How To Find Correlation In Google Sheets.
How To Calculate Interquartile Range Using Formulas in Google Sheets.
An Interquartile range is described as a dispersion of data to find the middle or half of a data. It is abbreviated as IQR. It is also the difference between the third quartile and the first quartile. The formula used in calculating the interquartile range in Google sheets is
=(Q3-Q1)
Where; Q3 represents the third quartile and Q1 represents the first quartile.
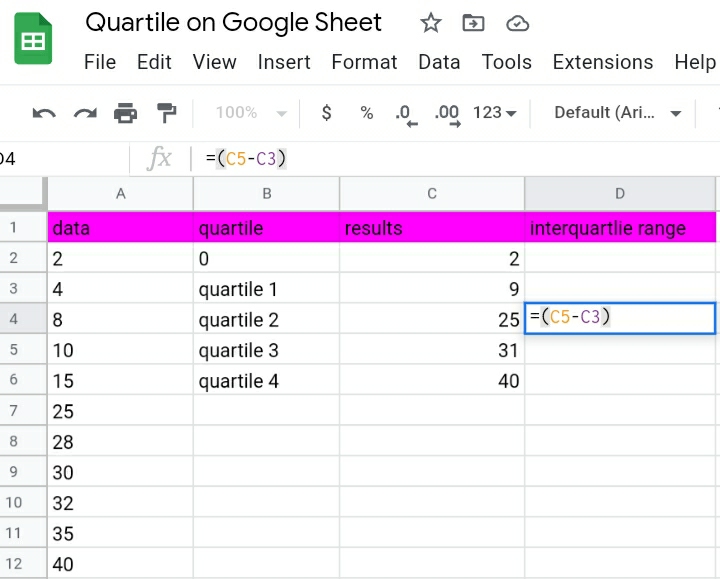
Step 1: Find the values of Q3 and Q1 on your worksheet. We would make use of our worksheet used to evaluate topic 1 where the quartile values have been solved already.
Q1=C3 and Q3=C5
Step 2: Input your formula into the function tab =(C5-C3). Click Enter.
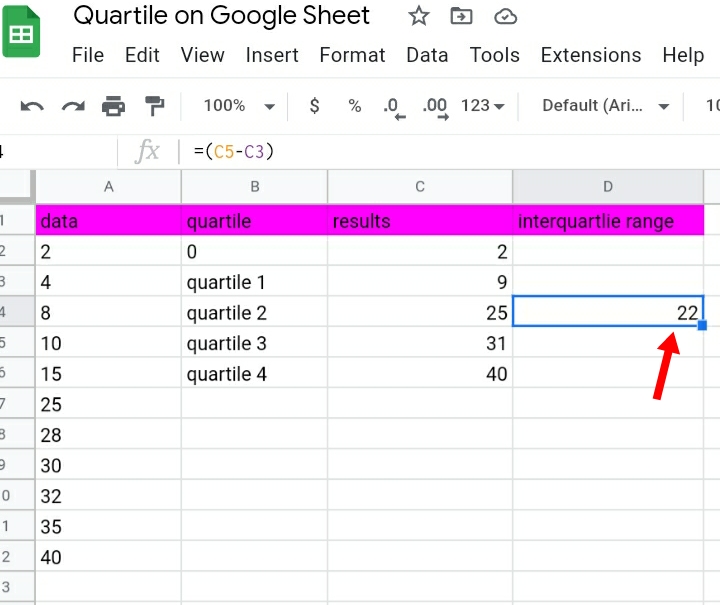
Step 3: The interquartile range is solved immediately. As you can see below, the IQR of this dataset is 22.
Frequently Asked Questions(FAQ)
There are multiple questions asked about the comparisons and effectiveness between Google Sheets and Microsoft Excel. Here we would be answering a few of these questions concerning the quartile function in Google sheets.
Question 1: Is the quartile function in Google sheets compatible with Excel?
Yes. Both Google Sheets and Microsoft Excel have the quartile function. Although Microsoft added some extra features to the quartile function which are quartile inc and quartile exc. The original quartile function still works well in Excel.
Quartile inc and quartile exc are also added functions in Google sheets which make both apps convenient to use either way.

Quartile inc uses the same formula and procedures as the one we discussed in topic one. Quartile exc is different in its syntax formula where it only utilizes quartile ranges from 1 to 3 which produces results entirely different from that of quartile inc functions.
Question 2: What do percentiles mean when talking about quartiles?
As the word “percentiles” implies, it has to do with percentages. Percentiles simply express quartiles in terms of percentages. Quartiles divide data into parts of four, which means percentiles of data are sections of four expressed in percentages.
● The first quartile is represented as the 25% of a quartile or the 25th percentile
● The second quartile is represented as 50% of a quartile or the 50th percentile.
● The third quartile is represented as 75% of a quartile or the 75th percentile.
● The fourth quartile is represented as 100% of a quartile or the 100th percentile.
Conclusion:
At the end of this guide, one would have fully understood the terminologies and procedures to identify and calculate quartiles and interquartile ranges in Google sheets without difficulty. I hope you found this guide helpful. Thank you.


