Correlation in Google sheets is used to view the relationship between two data sets. It is mostly employed when analyzing two sets of variables in your worksheet. It only applies to numerical values in your worksheet.
In this guide, we are going to discuss what correlation means and How To Find Correlation In Google Sheets.
What is Correlation in Google Sheets?
Before we fully delve into the topic, we must know and understand the basics of correlation in Google Sheets. Correlation, otherwise known as the Pearson Product-Moment Correlation Coefficient, is a calculation or value depicting the common relationship between two variables.
It indicates how much one variable is dependent on the other, how they are in sync and the relationship between them. It can also be displayed graphically in a scatter chart.
What does the Correlation coefficient say about your data?
The correlation coefficient denoted as ‘r’, gives an idea of the relationship between two datasets. The range between a negative one and a positive one signifies a vital correlation.
There are three measures of correlations one may encounter in Google Sheets. Each measure interprets a different relationship between the variables.
- Positive Correlation.
- Negative Correlation.
- No Correlation.
Positive Correlation.
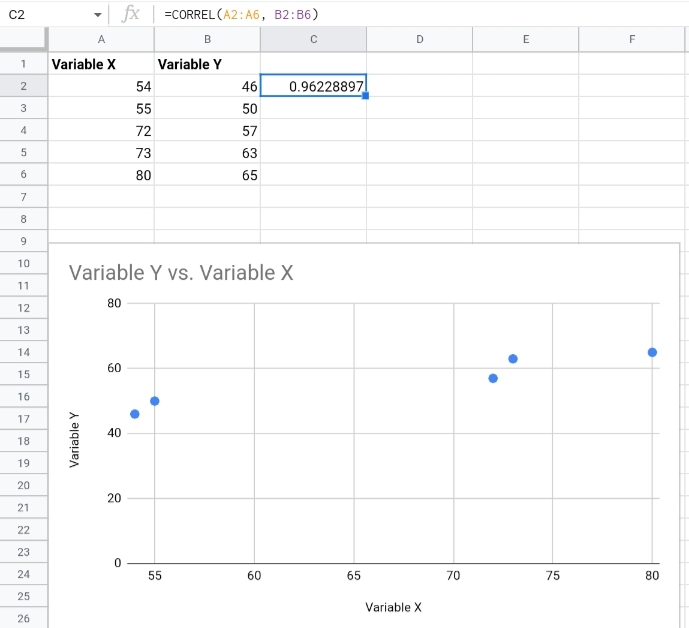
A correlation is said to be positive when it falls between the coefficient range of 0.9 and 1. It means a positive change is present in the two sets of variables.
The correlation coefficient of 1 is the maximum value a coefficient can have. If a correlation has a coefficient of 1, it signifies that the data aligns to form a perfectly straight line.
Negative Correlation.
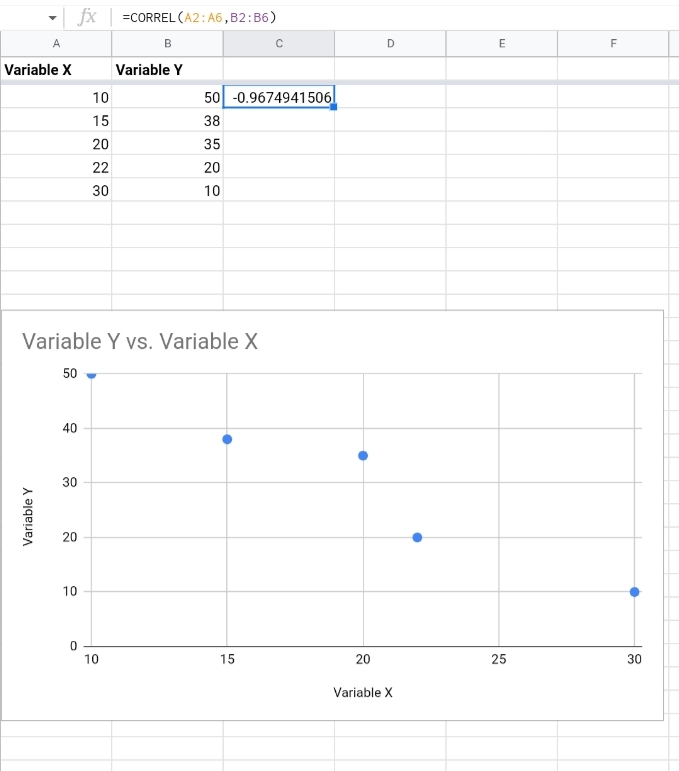
A correlation is said to be negative when it has a correlation coefficient of -0.9 or less. This indicates that the data is properly aligned but variable x increases constantly while variable y decreases.
No Correlation.
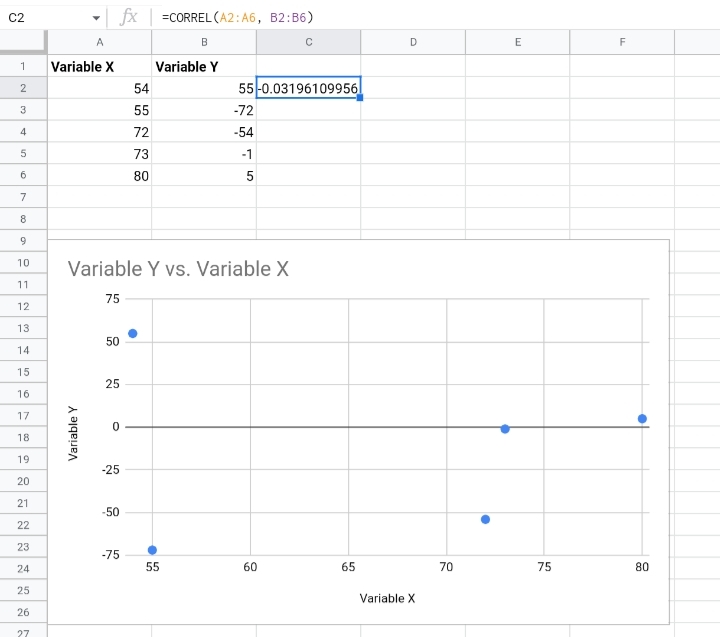
If a correlation coefficient falls between 0.01 to 0.1, it is said that the two variables do not correlate because there is no tangible relationship between the two variables. The variables do not depend on each other.
Note: To give a valid representation of the correlation between the two variables, it’s better to draw a line of best fit. This only applies to the positive and negative correlations. It is impossible to find the best fit in a dataset with no correlations.
The formula of Correlation in Google Sheets.
To find the correlation coefficient of a dataset, a formula is required. To find the coefficient in the dataset, the CORREL function is used. The CORREL function takes the syntax below.
=CORREL(dataset x, dataset y)
Where;
- Dataset x is variable x. It could be a cell range in a single column comprising the dependent values.
- Dataset y is variable y. It is the second cell range comprising the independent values required in the formula.
How To Find Correlation in Google Sheets?
Correlations in Google sheets are usually between two variables but can be done with more than two datasets.
Assuming you have datasets A, B and C, to calculate your correlation coefficient, you have to take the datasets as a pair. That is datasets A and B, datasets B and C and datasets A and C.
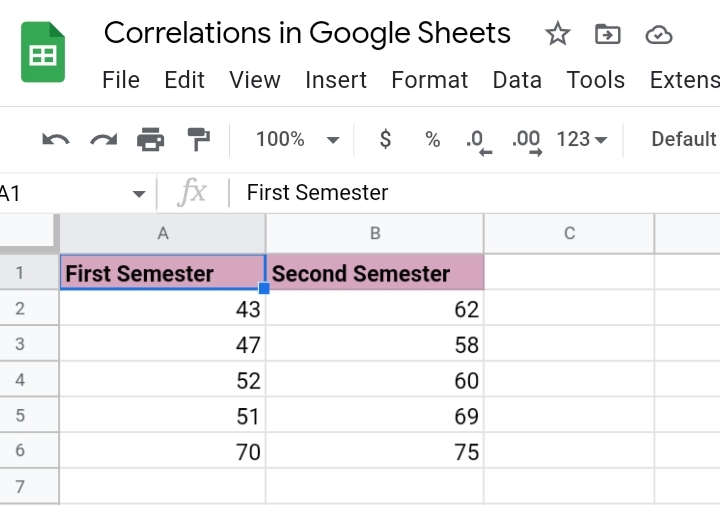
This is more complicated and advanced but for starters, we are going to work with two data sets. Using the sample worksheet below, we’ll find the correlation coefficient between the variables.
We want to compare the grades of some students on math tests between the first semester and the second semester and find the increase or decrease between the two variables.
There are two methods used in finding correlations in Google Sheets.
- Using brackets.
- Using range references.
Finding Correlation Coefficients using brackets.
This method involves the direct input of the numeric values into the formula’s parentheses.
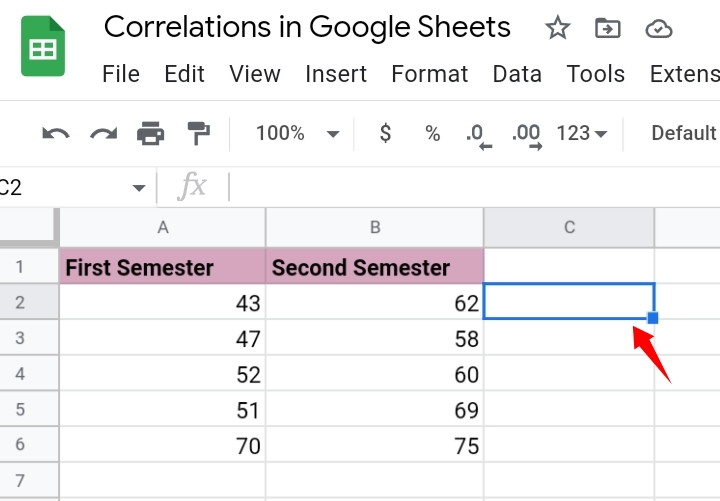
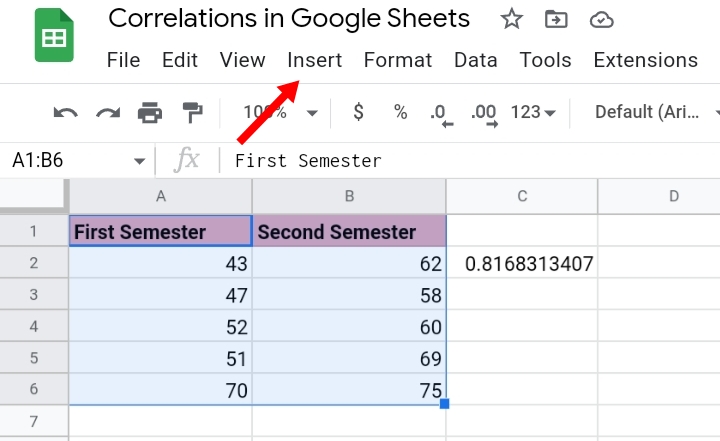
Step 1: Select an empty cell where the result would be displayed. In our case, we’ve selected cell C2.

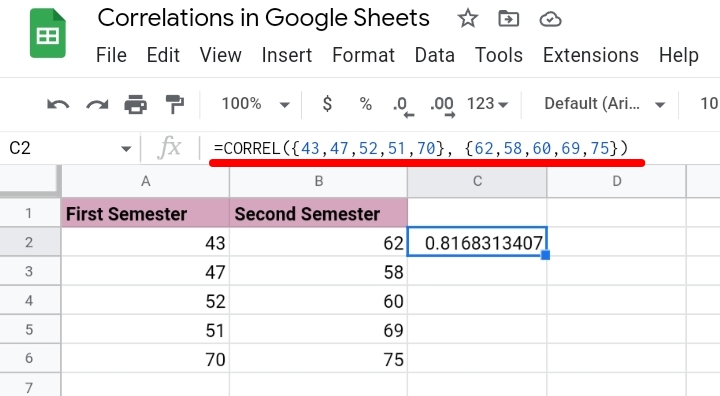
Step 2: Input the formula but the values of the grades are inputted directly as the formula’s parameters. But the round brackets are replaced with the curly parentheses to separate the numbers. That is,
=CORREL({43,47,52,51,70}, {62,58,60,69,75})
Step 3: Hit the Enter key and the correlation coefficients are inputted into the result cell.
Finding Correlation Coefficients Using Cell Range References.
You can also input the cell range directly into the formula. In this method, the curly parentheses aren’t used, the normal round brackets are used.
Step 1: Select an empty cell where the result would be displayed. In our case, we’ve selected cell C2.
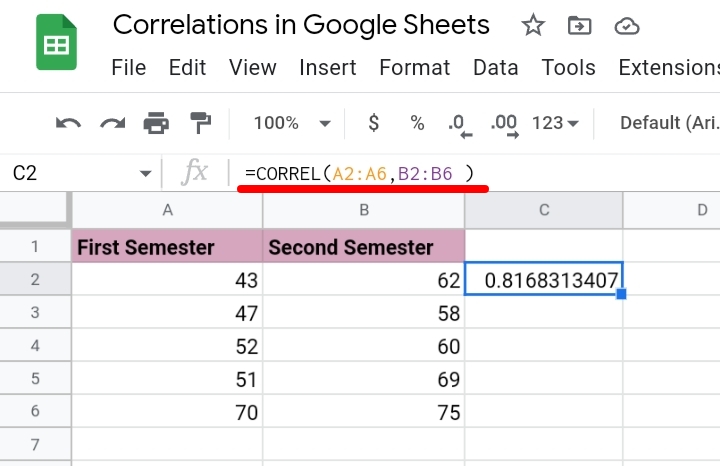
Step 2: Input the formula but include the cell ranges of variable x and variable y.
=CORREL(A2:A6, B2:B6)
Step 3: Hit Enter and the correlation coefficient is displayed in the cell.
Note: In each result above, the coefficients are the same. This implies that the mode of application does not affect the interpretation of the relationship between variable x and variable y.
You can also create a scatter chart to illustrate the relationship between the variables. So we selected the second method which uses the cell ranges as the bases of our scatter chart.
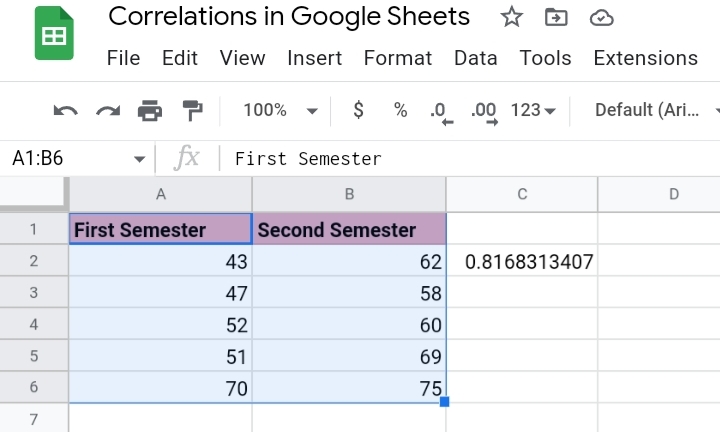
Step 1: Select the two ranges of variable x and variable y.
Step 2: Go to the toolbar and select Insert.
Step 3: From the drop-down list, select Chart.
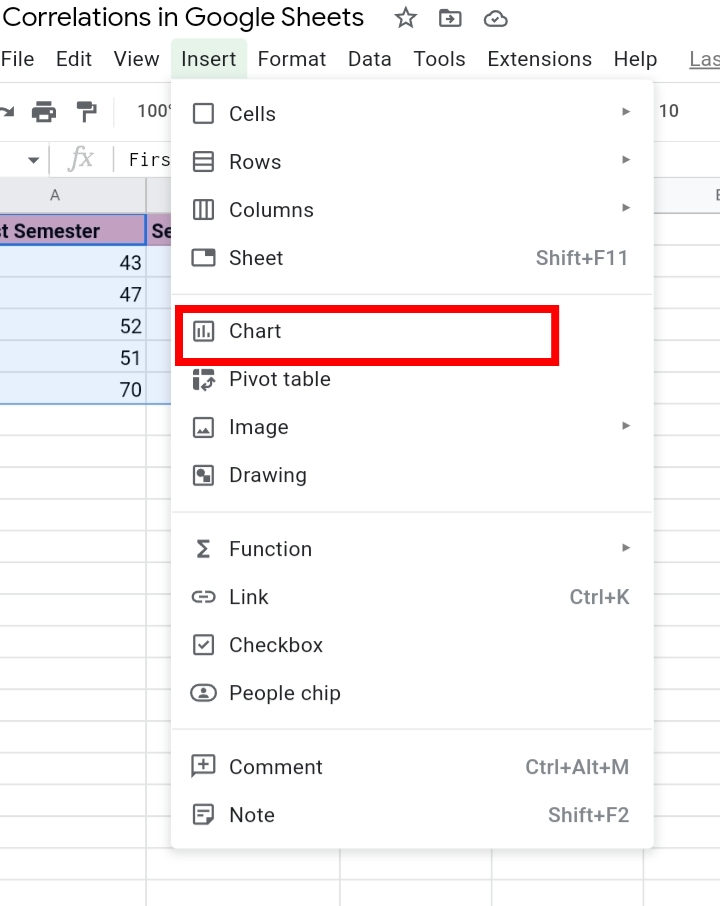
Alternatively, you can go to the Insert Chart icon at the far right of the toolbar.

Step 4: A chart is displayed on the worksheet.
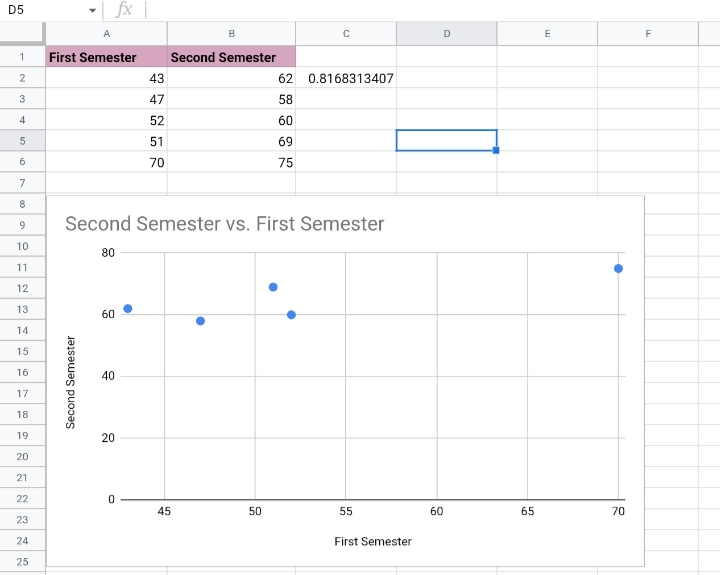
If Google Sheets doesn’t automatically give you a scatter chart, you can open the chart editor by double-clicking your chart and selecting a scatter chart under Chart Type.
Step 5: You can customize your scatter chart to how you want it under the Customize tab in the Chart Editor.
As you can see, in both cases the correlation coefficient is 0.8, which falls in the range of the positive correlation. That means both variables x and y have a strong alliance.
Frequently Asked Questions on Correlation Coefficients in Google Sheets (FAQs)
Why does my formula return a Not Available (#N/A) Error Message?
A #N/A error is returned when there’s an uneven number of values in variable ranges. In case you get this error frequently when finding correlation coefficients in your worksheet, ensure the variables x and y ranges are of equal length and have the same number of values in their ranges.
What if either of my datasets has missing values?
If there are blank or empty cells in the variables list, they are completely excluded and ignored. No error could occur as long as the two ranges have an equal number of values.
How do you do a correlation in Google Sheets?
To do a correlation, input the range of variables’ values in the CORREL formula. When the correlation coefficient is positive, there is a perfect relationship between the two variables.
If the correlation coefficient is negative or equal to zero, there is a decreasing or no relationship between the two variables. To see the examples properly and how the results look, view the second section of this guide.
How do you find the Correlation Coefficient in Google Sheets?
By using the CORREL function. You can see the CORREL function syntax and how to use this formula in the third section of this guide.
What is a Good Correlation Coefficient in Google Sheets?
A good correlation coefficient is determined by the presence of a negative or positive value. If the coefficient is equal to zero, it isn’t a good correlation.
How do you find residuals in Google Sheets?
Residuals in Google Sheets means the variation between the original and anticipated values of the variables. Residuals are found by using the SLOPE and INTERCEPT functions to locate the line of fit.
The line of fit is otherwise called the gradient of the values in the scatter chart. To find the anticipated values of variable y for each variable x, use the formula y=mx+c. The residuals found matching each variable’s original value are called the predicted values.
Final Thoughts.
Correlation Coefficients are commonly encountered features in Google Sheets, especially when analyzing two different sets of data. If calculated wrongly, could give wrong information about the values on your dataset.
This function is very helpful when evaluating the relationships between the values in your dataset. If this task gave you a lot of frustration and confusion, I hope we were able to clear all confusion and difficulty with the correlation coefficients.
Now you know How To Find Correlation In Google Sheets. I hope you found this tutorial informative. Thanks for reading.


