What is the percentage?
According to the Oxford English Dictionary, Percentage is defined as a ratio, number or proportion in relation to a whole which is usually the amount per hundred. A percentage is represented with the symbol, %. It expresses numbers as portions or ratios of a hundred.
It is a very important mathematical expression that is used in the following ways:
● Financial sectors of businesses.
● For the evaluation of numerical values, rates and statistics.
● For statistical analysis and examinations.
● Percentages are also used to express figures in diagrams, graphs, charts, maps and data coding.
● To show an increase or decrease in figures or information.
● In our everyday lives as a whole, whether at schools, mathematics education, small scale businesses, banks, loans, deals on items etcetera.
The percentage can also be used to calculate numerical data on Google sheets. It is a very important element of statistics in Google sheets. When working with heavy and large data on your worksheet, you want to measure the percentage taken by each value or data, you would have to calculate the proportion of each data occupied.
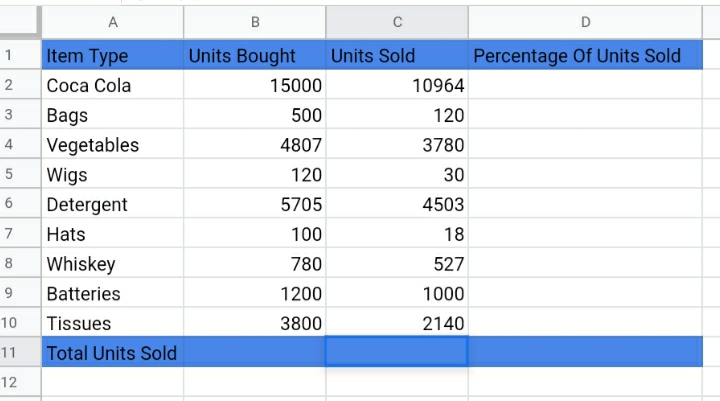
In this tutorial, we will be looking at how to calculate the percentage in different ways on Google sheets with the sample worksheet below:
How To Calculate Percentage of Total in Google Sheets
This is used to measure the percentage of total values of data inputted in your worksheet. The formula used for this technique is:
Unit sold. × 100
Total Unit Sold
When this formula is utilized following the steps below, it shows us the sales per cent of each item on the worksheet.
Step 1: We have to find the Total Unit Sold first, by adding all values of data in column C using this formula, =SUM(C2:C10).
Step 2: Enter the formula in the function tab above your worksheet.
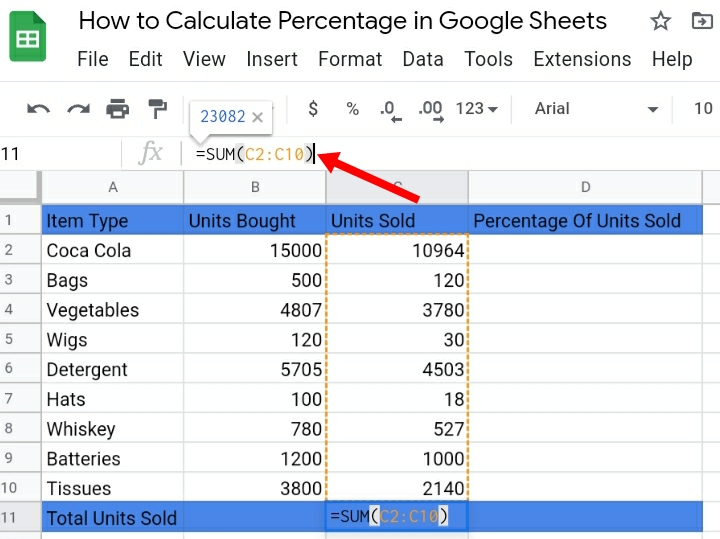
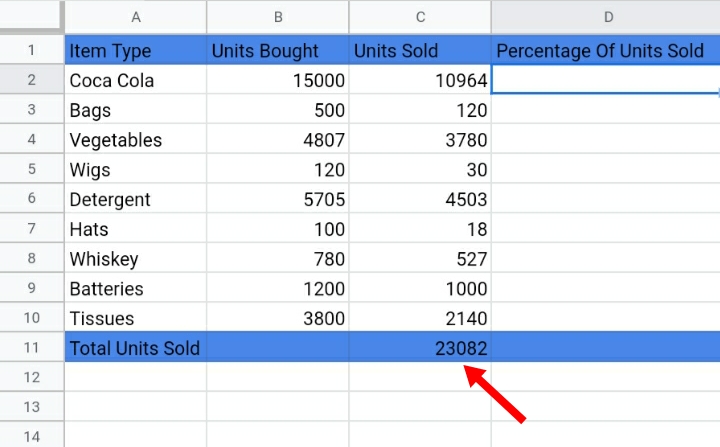
Step 3: Click Enter. The total sum of units sold is provided below at C11.
Step 4: To find the percentage of the total, each value of units sold is divided by the total sum of units sold, that is;
=(C2/$C$11)
Where;
C2 represents the value of each unit sold
$C$11 represents the value of the total sum of units sold.
Explanation:
In the formula above, there are dollar signs placed in C11. Why? These dollar signs are used to lock the values in C11 to prevent them from changing when calculating the percentage for each row.
In other words, it tells your Google sheet that this formula would be used throughout the column and you don’t want the formula moved or replaced. This is referred to as The Absolute Cell Reference.
Step 5: Enter the above formula into the fx or function tab.
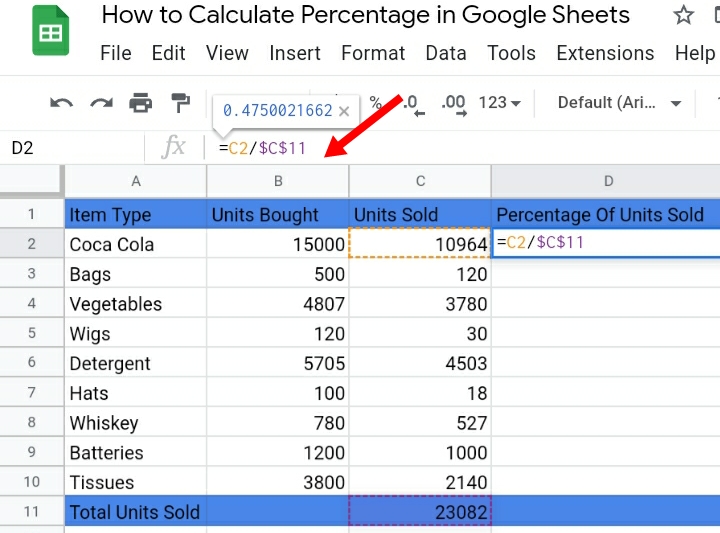
Step 6: Click on Enter on your keyboard. The value total of each unit is displayed in column D.
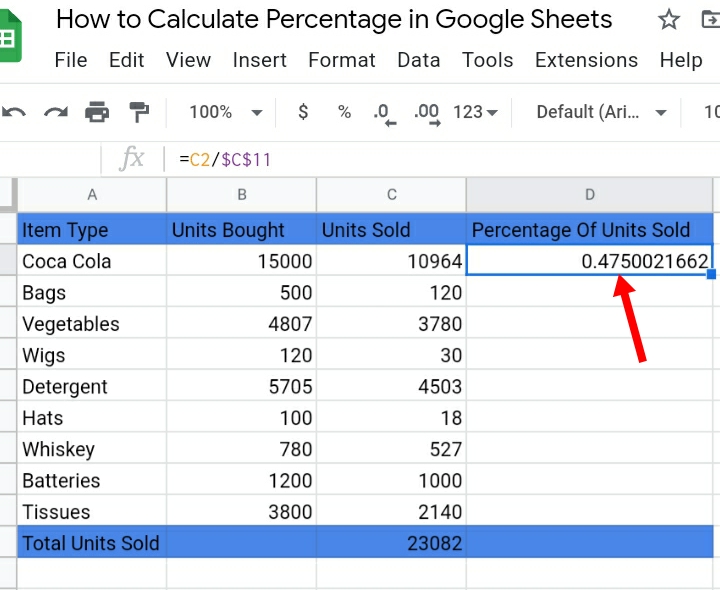
Step 7: Select the rows D3 to D10 to automatically auto-fill the formula in the rest of the rows.
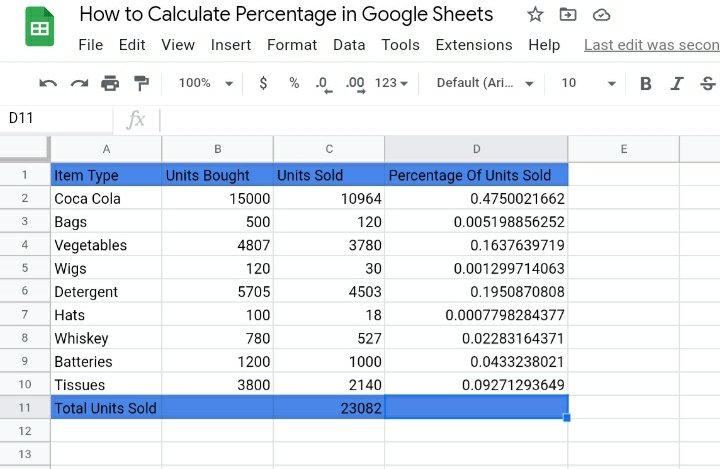
Note: All values of column D are not expressed in percentage yet. Follow the steps below to convert the data into percentages.
Step 8: Highlight the values in the rows in column D.
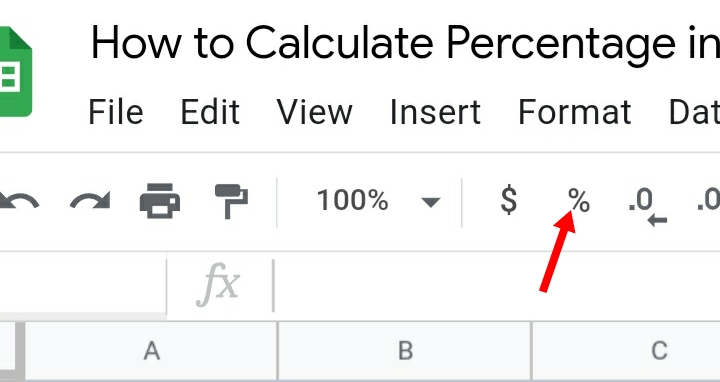
Step 9: Click on the % icon on the settings tab. This icon means Format as Percent and is used to express numbers into percentages.
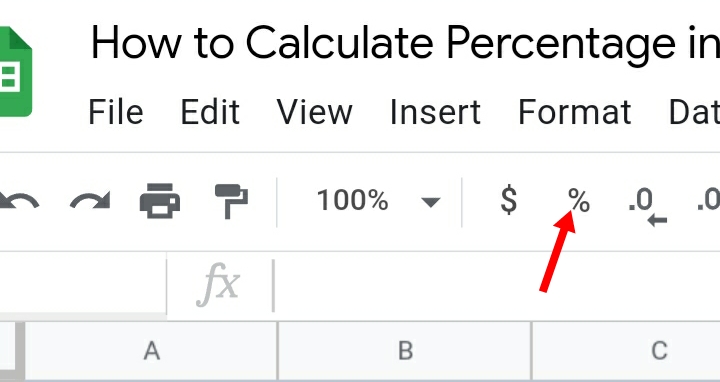
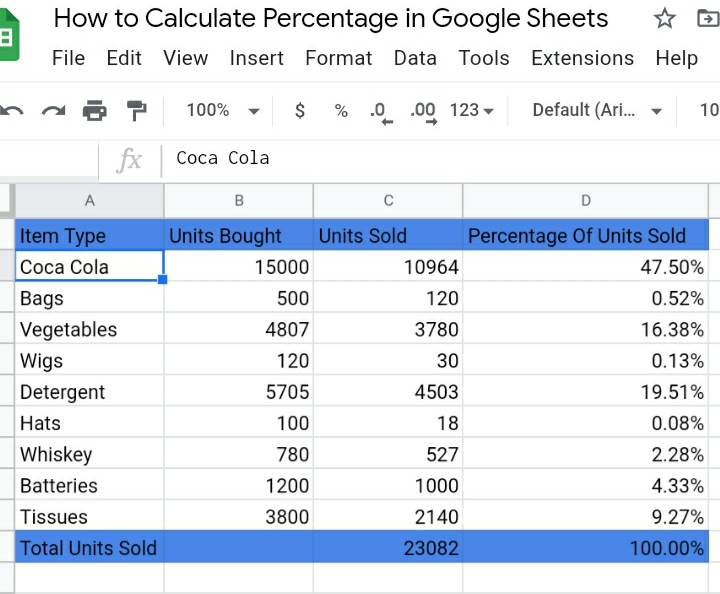
Step 10: Click Enter. All data displayed in the column is now expressed in percentage.
Note: All percentages in column C must sum up to 100%. This proves that the calculation has been done correctly.
How To Calculate Percentage of Proportion In Google Sheets
This is used to show the portion allotted to each row or cell of data in percentage on the worksheet. For instance, using the google sheet below to find the percentage of proportion, we must apply the formula to the worksheet below;
Unit sold × 100
Unit bought
Step 1: Input the above formula in terms of the column and row number in the fx tab.
=(C2/B2)
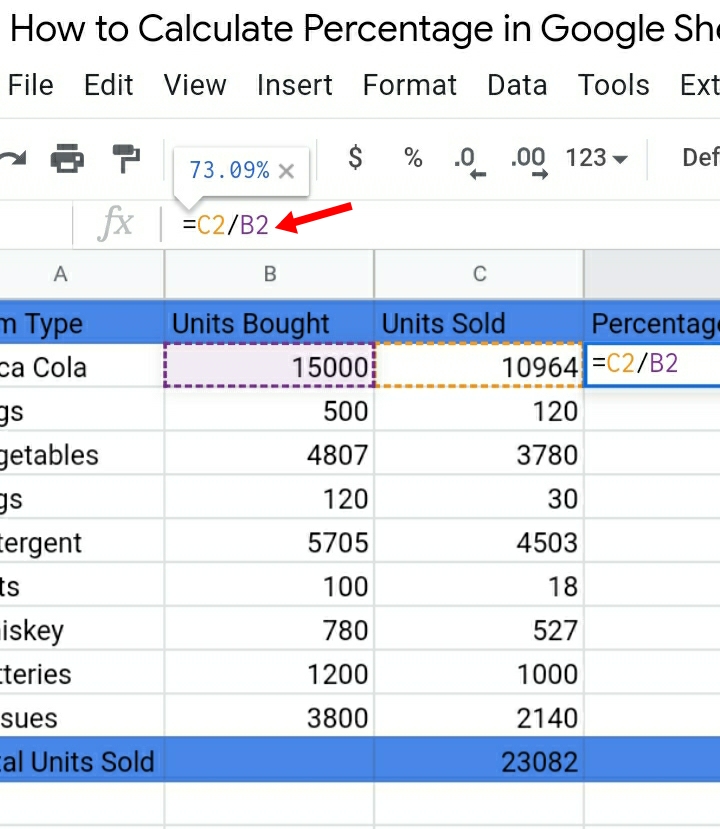
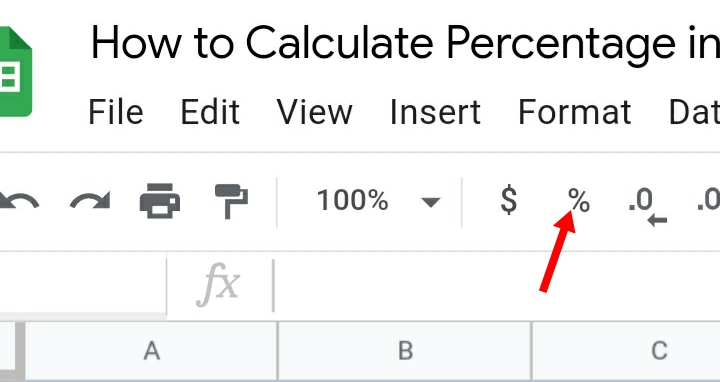
Step 2: Click on the % icon on the settings tab. This icon represents Format as Percent or you can apply 100 directly into the formula, that is: =(C2/B2)×100.
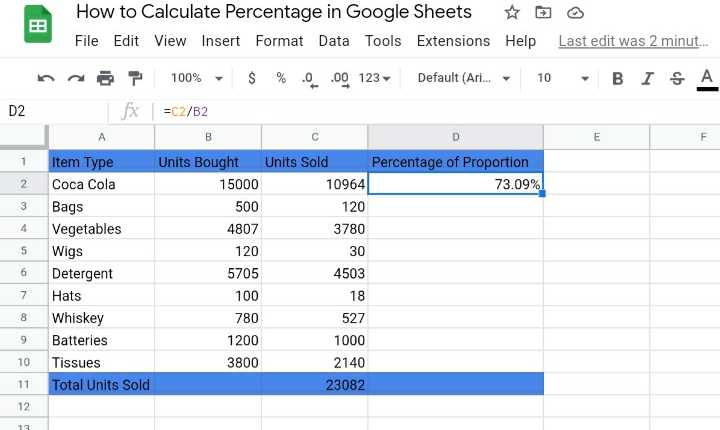
You would notice the outcome in D2 is now in percentage form.
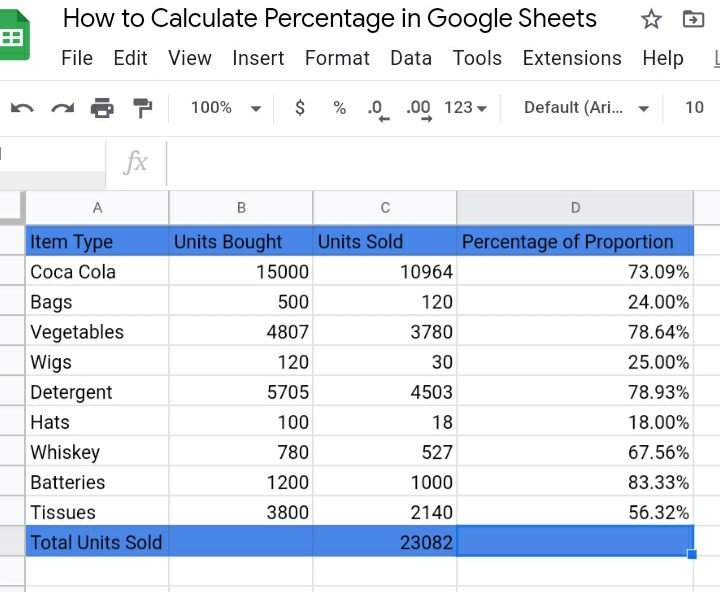
Step 3: Highlight the other rows in column D to copy the formula used to provide outcomes in percentage.
How To Calculate Percentage of Change in Google Sheets
This is used to compare two or more columns with different sets of data to express the values in percent. For instance, two different columns B and C contain data for Units Sold in January and Units Sold in February respectively.
These sales are bound to either increase in January and decrease in February or decrease in January and increase in February or can be mixed up.
This is where we would like to see the percentage of change (increase or decrease) on our Google sheet.
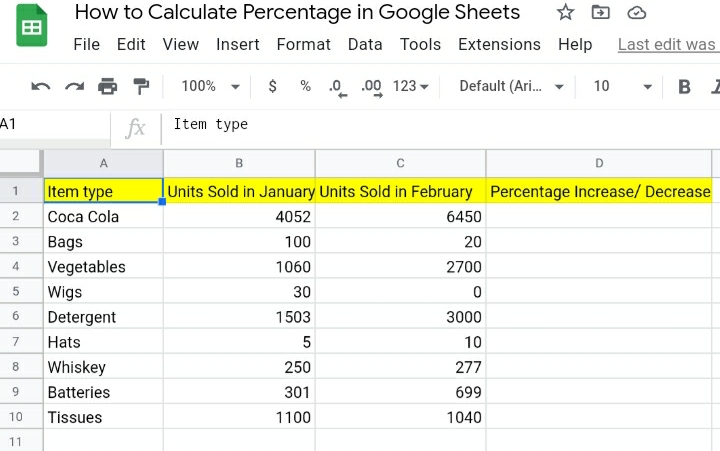
The general formula used to determine the change is;
Unit Sold in Feb- Units Sold in Jan ×100
Units Sold in Jan
OR
=(C2-B2)/B2
To utilize this formula properly, we need to take the steps below:
Step 1: Input the formula =(C2-B2)/B2 in the function tab.
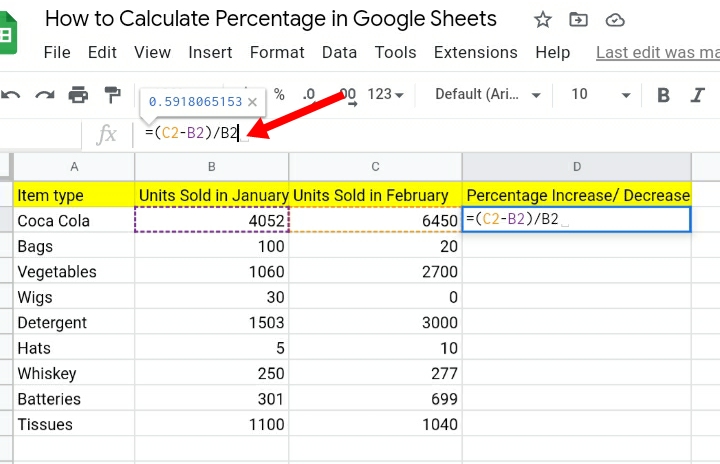
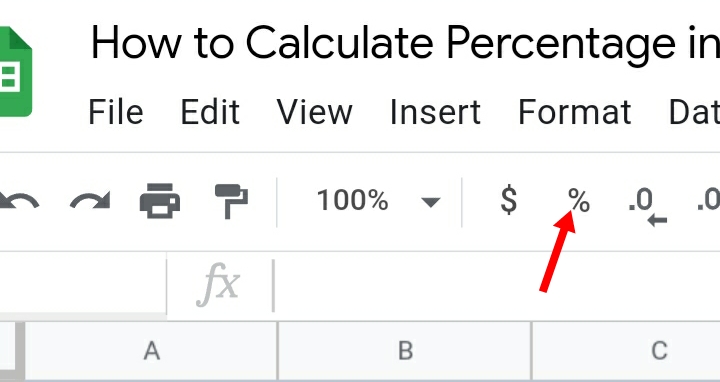
Step 2: Click on the % icon (Format as Percent) on the settings tab.
Step 3: Click Enter.
Step 4: The percentage increase or decrease is placed in D2.
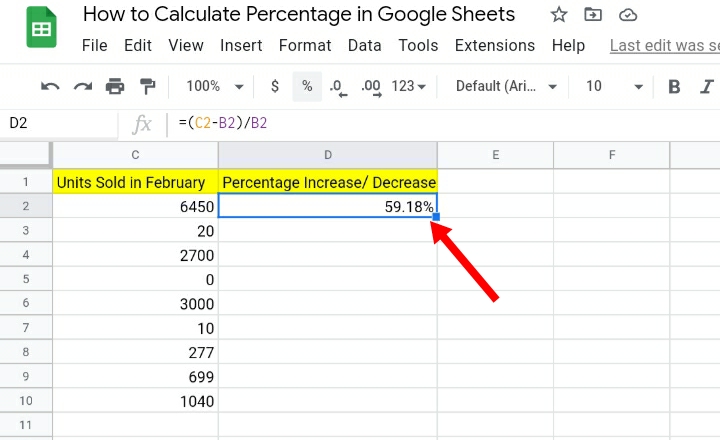
Step 5: Highlight the other rows in column D to copy the formula used to provide the solutions in percent change.
Some percentages are negative values which means the unit sales decreased while the positive percentages imply that the unit sales increased in a month.
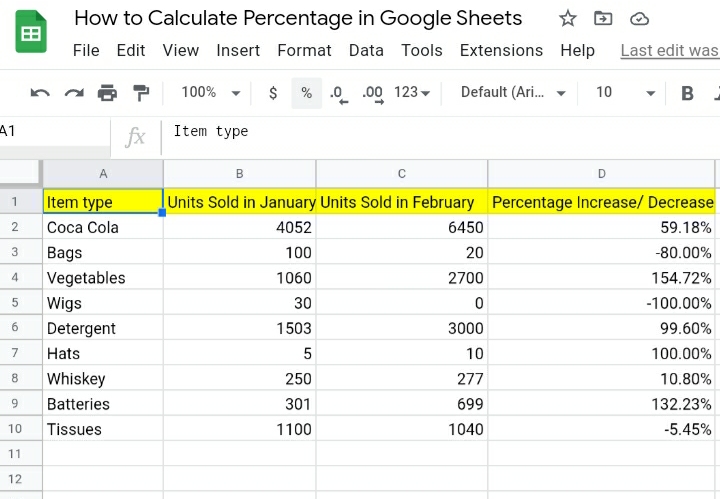
This method is very useful to business owners, marketers, entrepreneurs and salespeople who would like to keep tabs and view the percentage of sales increase or decrease on every item sold in each month.
How to Calculate Progressive Percentage in Google Sheets
This is defined as the percentage difference added from one data to another over some time in a worksheet. Progressive or Cumulative percentages are always increasing, they can’t have negative values. This technique is divided into two parts.
- Finding cumulative values for each row in the column.
- Converting the values into percentages.
With the steps taken below, this topic on how to calculate cumulative percentages would be made easy to recognize and perform on your google sheet.
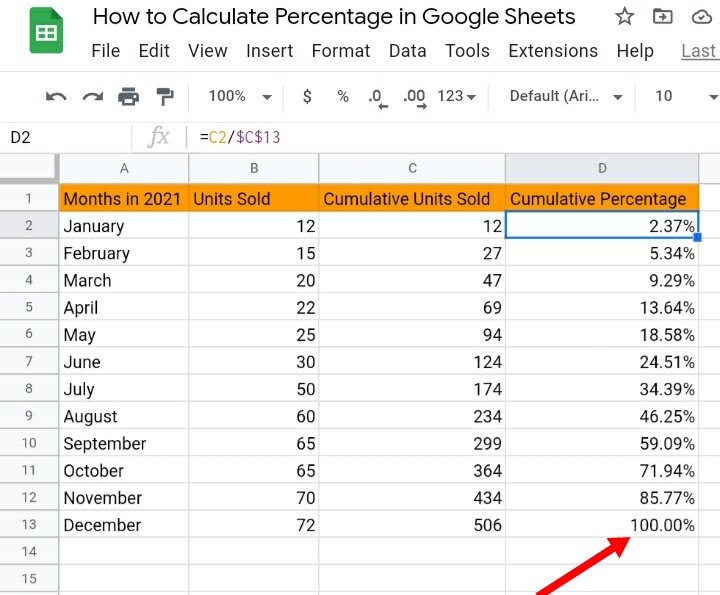
Using the worksheet below, which indicates the number of units sold of chocolate bars sold by a group of Girl Scouts, throughout 2021, from January to December.
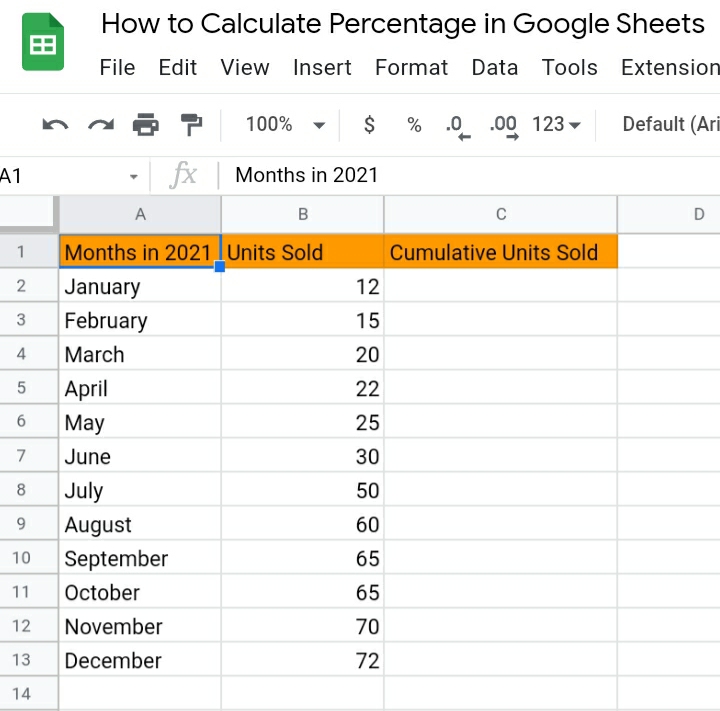
PART 1: We find the cumulative values for each row in column B.
Step 1: Input the formula =SUM($B$2:B2) into the function or fx tab above your sheet. This formula is used to calculate the cumulative values of each row in column B.
Remember, the dollar signs placed in the formulas are used to lock that particular value on the worksheet.

Step 2: Click Enter. The formula provides results of the cumulative data of C2.
Step 3: Highlight the remaining rows from C2 to C13 to copy the formula in the rows. Click the Ctrl key + Enter.
OR.
A pop-up notification will appear on the window asking to Auto-fill the answers to the column automatically. Click on the tick ✔️ and the results will be pasted on the column for you.
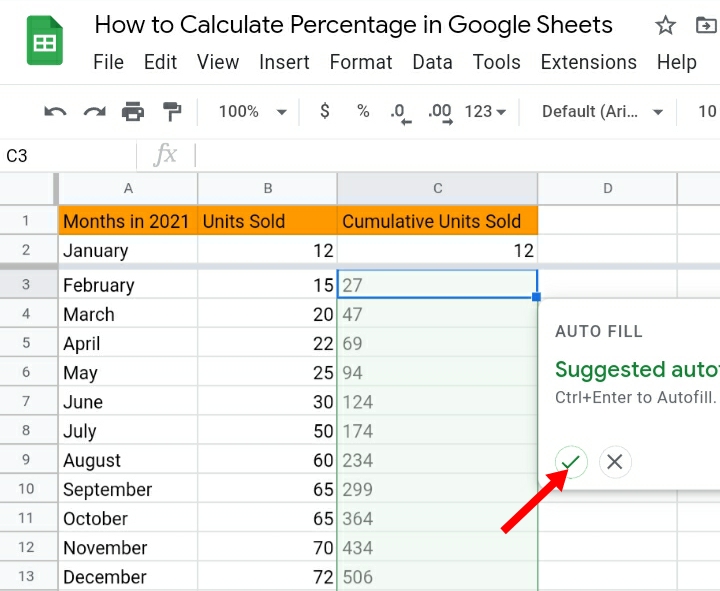
It is very easy and quick to do.
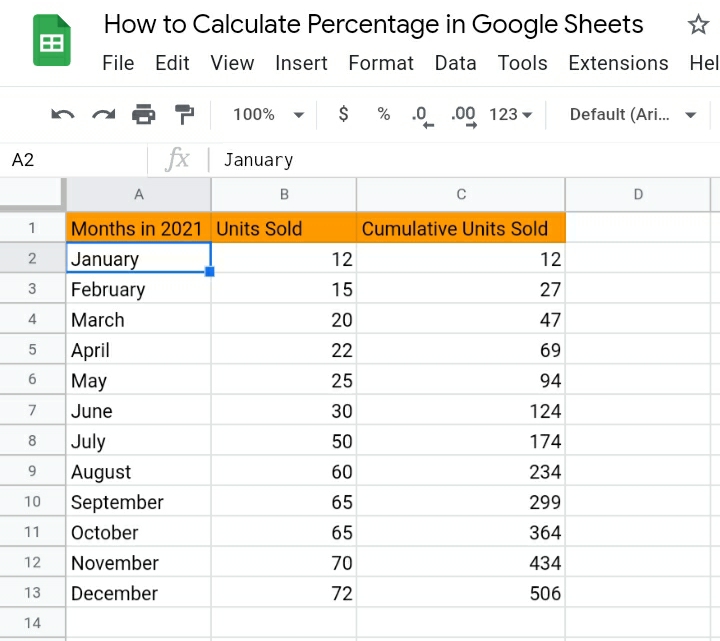
PART 2: Converting the values into percentages.
Step 4: Now, we find the cumulative percentage of each item in column D. Input the formula =C2/$C$13. Click Enter.
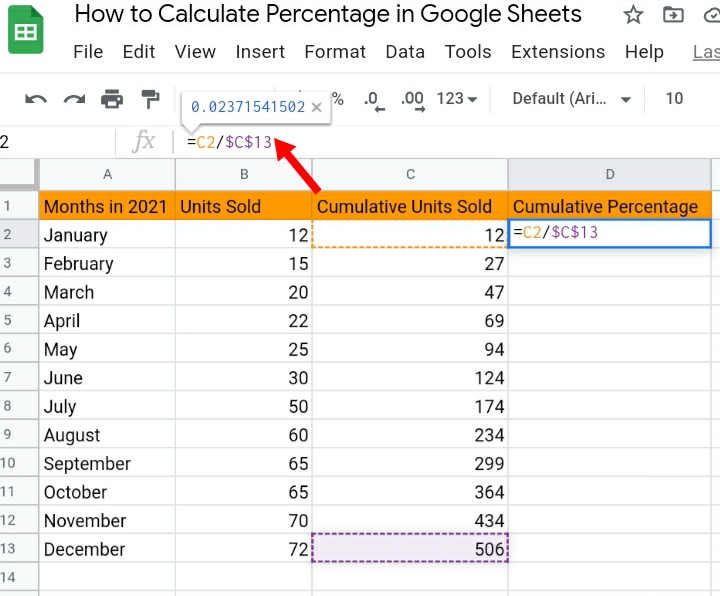
Step 5: The formula produces a result in D2. Highlight the remaining rows and copy the formula downwards. Click the Ctrl key + Enter or use the auto-fill method to copy the results.
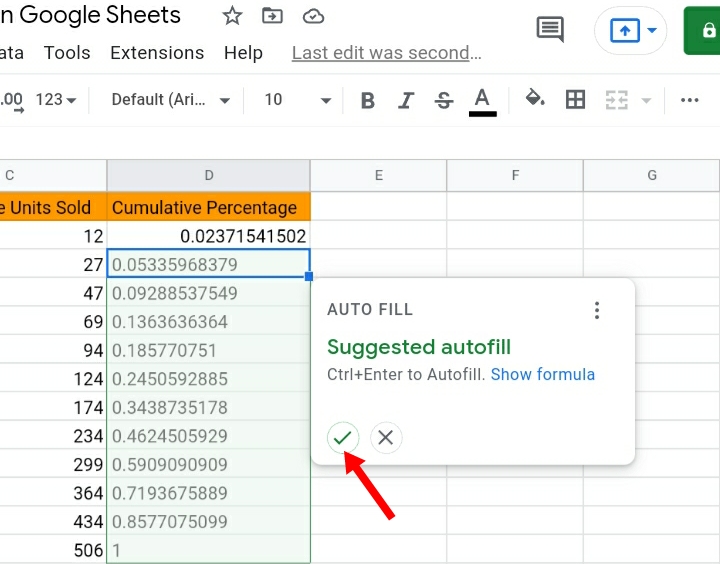
NOTE: The Progressive percentage has not yet been solved. As you can see, the values have a lot of decimal places. We need to format the values as a percentage, to get rid of the long decimals.
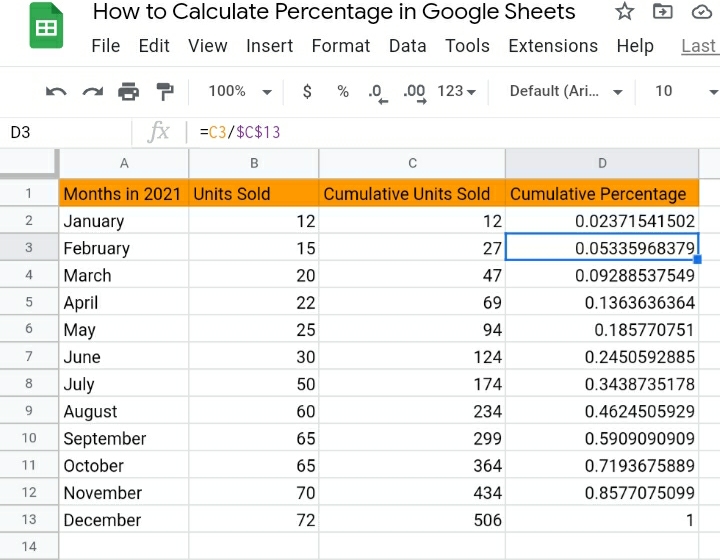
Step 6: Select all the rows in column D.
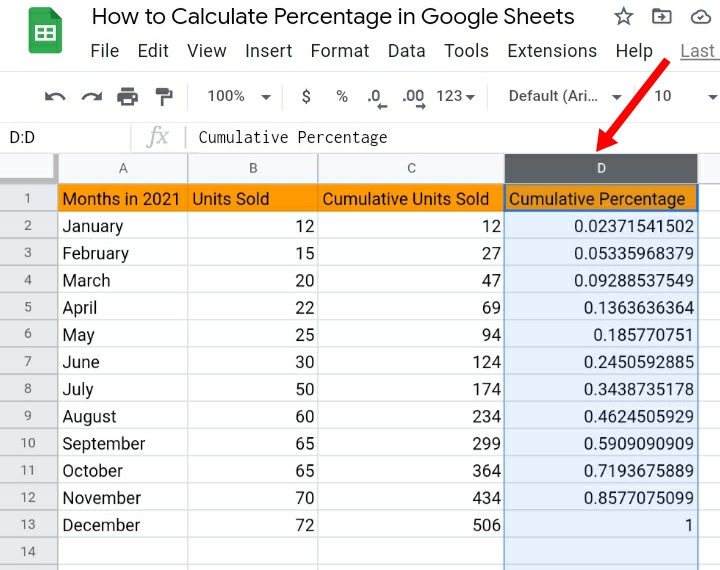
Step 7: Click on the % icon (Format as Percent) on the toolbar.
All data in column D are automatically converted to percentages.
Why use Percentage in Google Sheets?
The percentage feature is a very essential tool in Google Sheets. It assists to give a brief and detailed understanding, clear statistical analysis of your data as a proportion of a hundred.
Large sets of decimal numbers in a row with more than one decimal place are easily and simply converted to percentages which make discerning data easier.
Conclusion
Although the calculation for percentage in Google Sheets is said to be a confusing and complex tool to use, with the above steps on the most important aspects on how to use it effectively, analysis has been made easy for anyone inputting and working with a given data in Google sheets.
Knowing how to evaluate and compare data in your worksheets is an important skill that can help you make reasonable choices on how to calculate
Once these aspects and formulas are mastered, all percentage difficulties would be very easy to operate and calculate.
Be sure to seize the time to practice this, because as they say; Practice makes Perfect. I hope you found this guide beneficial. Thank you.


