When representing data graphically, there are levels of uncertainty and intervals between each value in the dataset. These variables are represented as Error bars.
Understanding how to fix error bars in Google sheets is very important. In this tutorial, we are going to learn step by step How To Add Error Bars In Google Sheets.
What are Error bars in Google Sheets?
Error bars are used to indicate the intervals and differences in your chart. They are used to display variability and instability in data.
They are mostly used in column charts, area charts, line charts, and bar charts. Values in datasets tend to be imperfect or somewhat false due to the passing of information from one medium to another. Error bars help to display levels of uncertainty in a given dataset.
How To Add Error Bars in Google Sheets.
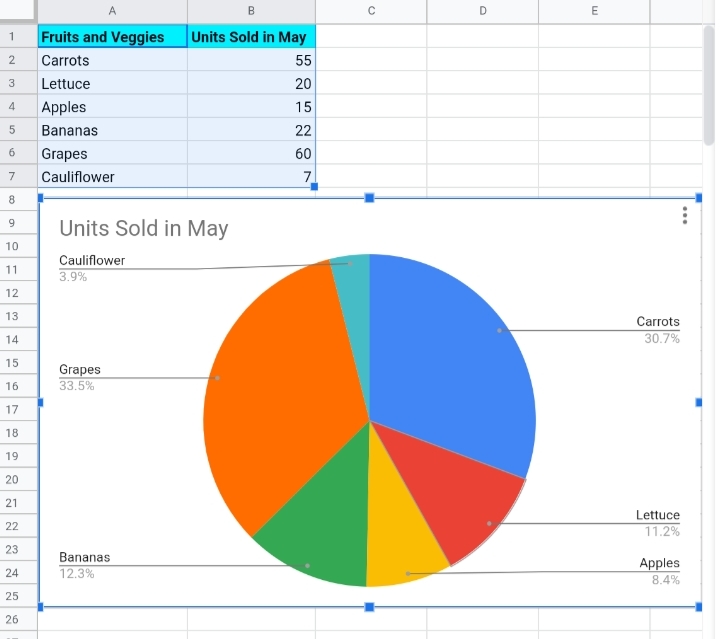
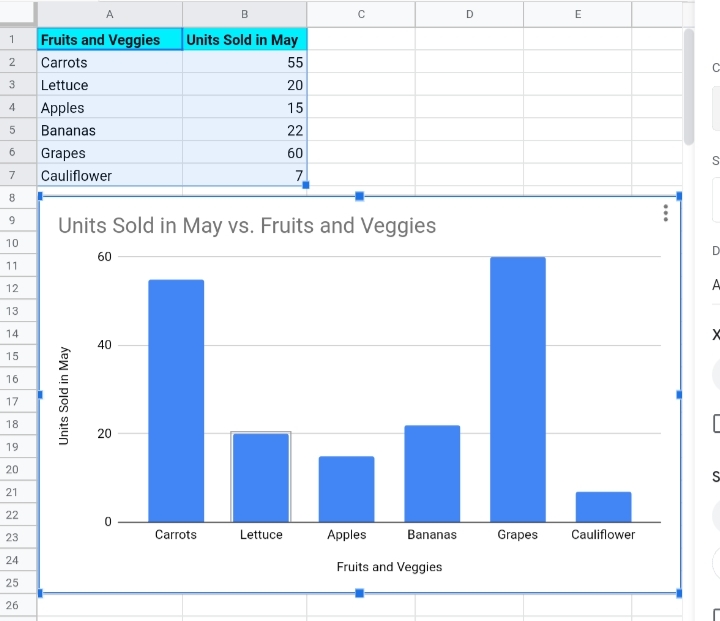
To add error bars, you must first create a column chart or bar chart with the given dataset. In the sample worksheet below, we have the names of fruits and vegetables and the total amount sold in May.
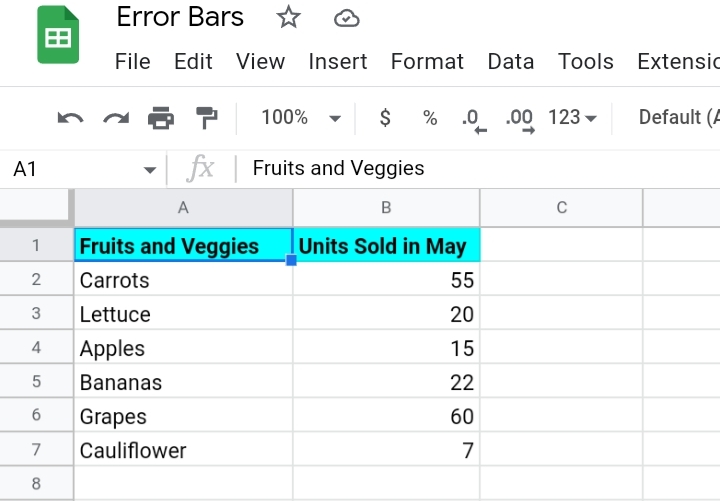
This is what we’ll use to create a chart and add error bars of values.
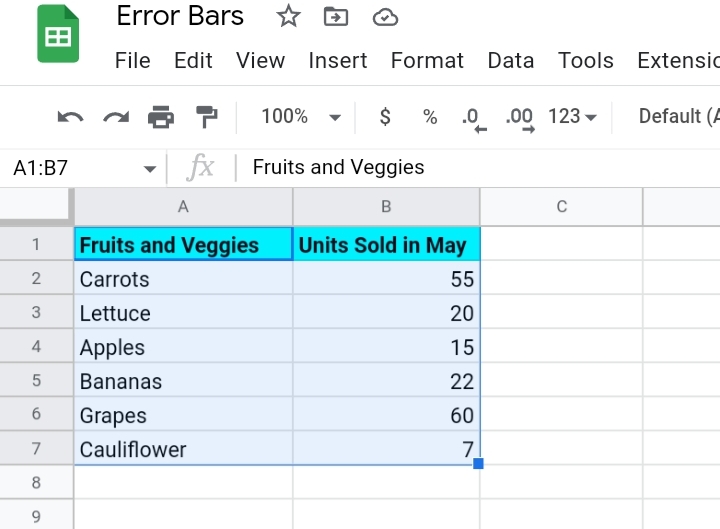
Step 1: Highlight the cell range. Ensure the headers are included in the selected range.
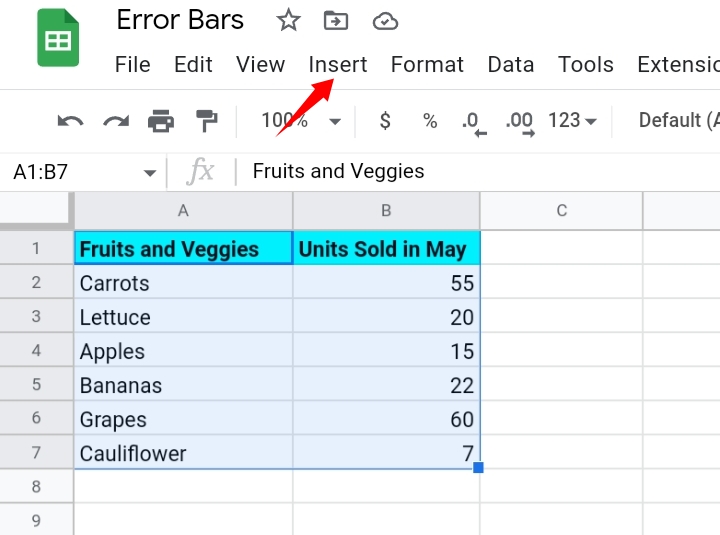
Step 2: Navigate your way to the toolbar and click Insert.
Step 3: From the drop-down menu displayed, select Chart.
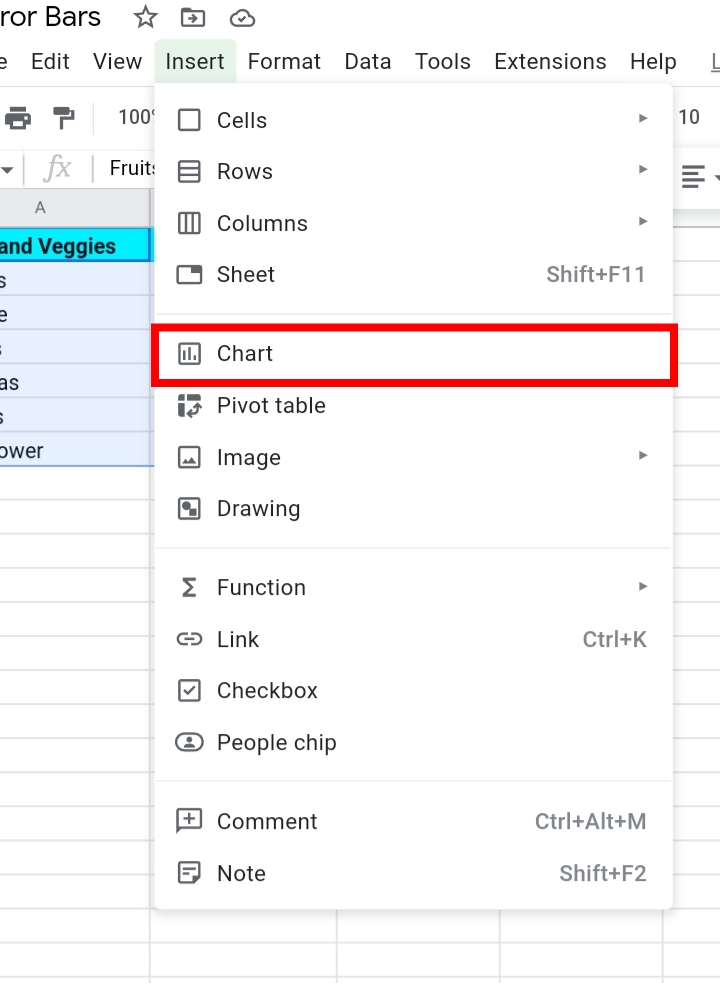
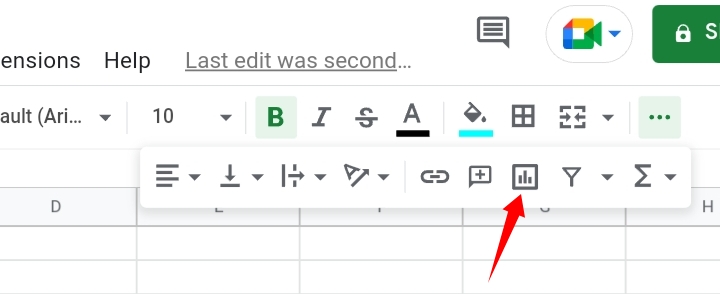
Alternatively, you can click on the Insert Chart icon on the far right of the toolbar.
Step 4: Google Sheets automatically inserts a column chart. Sometimes, a different chart like a pie chart can be inserted.
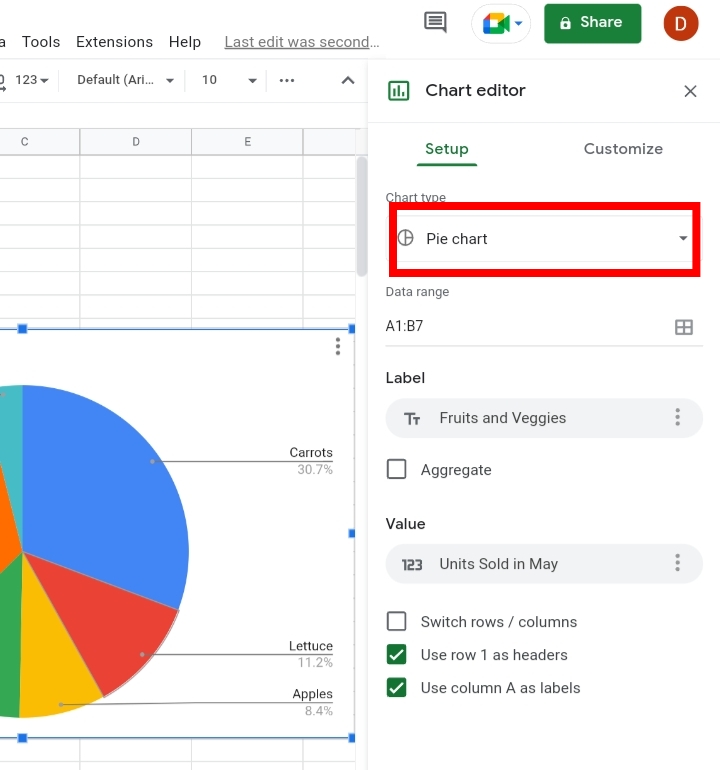
To change the chart type, double click on the chart to open the Chart Editor.
Step 5: Under the Setup Editor, select Chart Type and select the Column Chart to change the given chart.
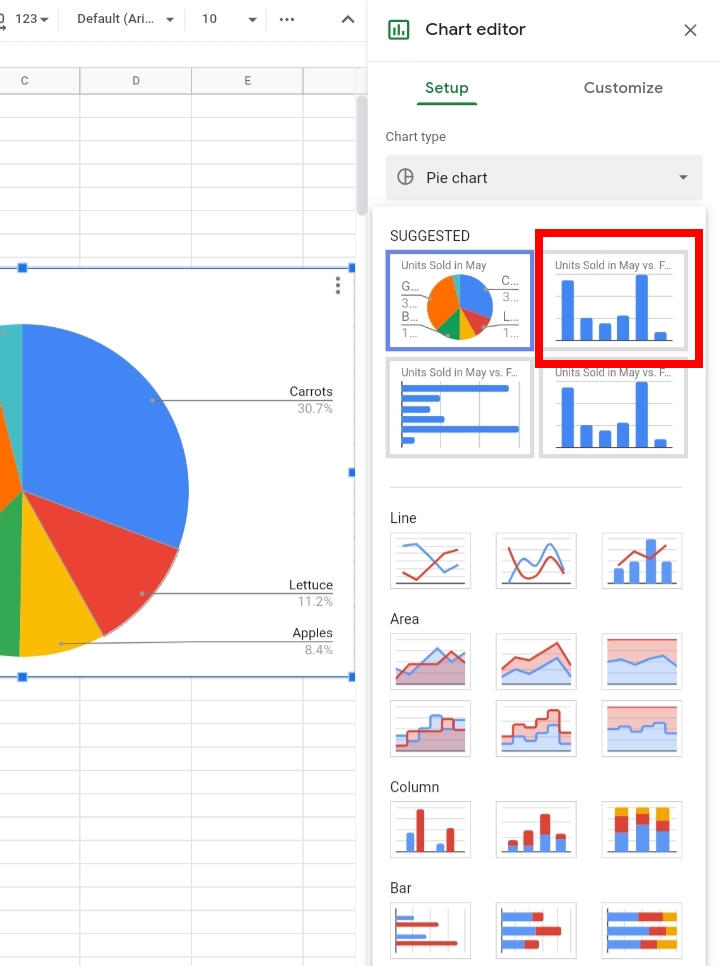
Step 6: A column chart is inserted into the worksheet.
Now that we have our column chart, let’s insert error bars into the chart. It is done by following the steps below.
Step 1: Open the Chart Editor by either double-clicking on the chart or clicking on the three dots and selecting Edit Chart.
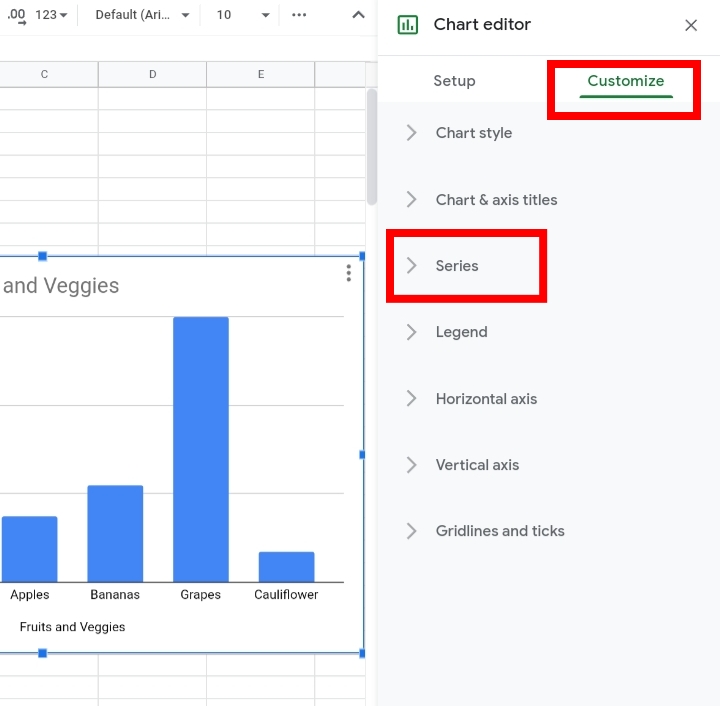
Step 2: Under the Customize tab, Select Series.
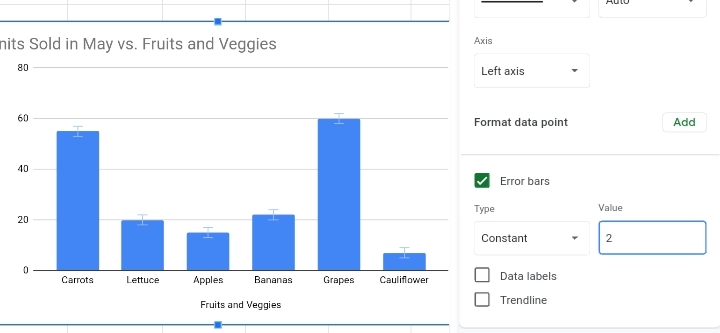
Step 3: Under the Series section, scroll down and check the checkbox beside Error Bars.
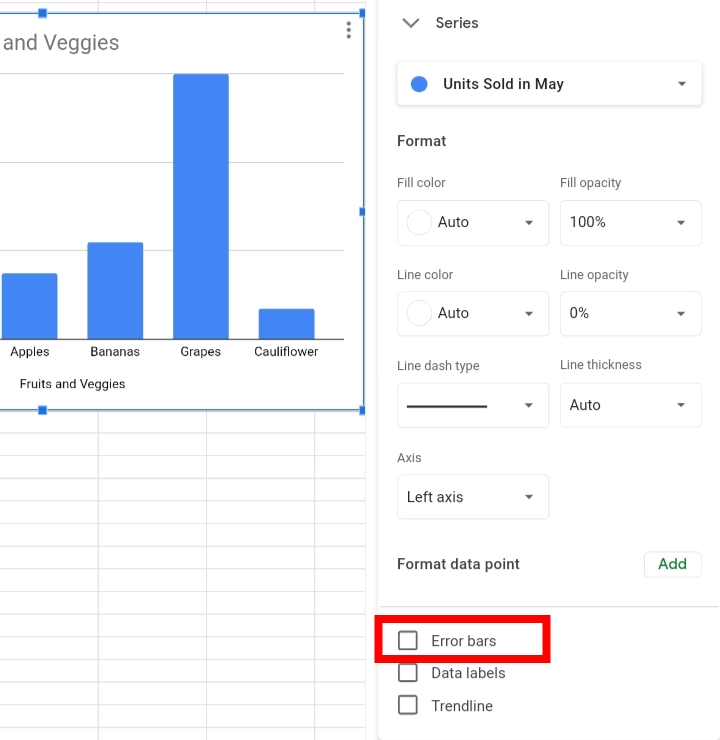
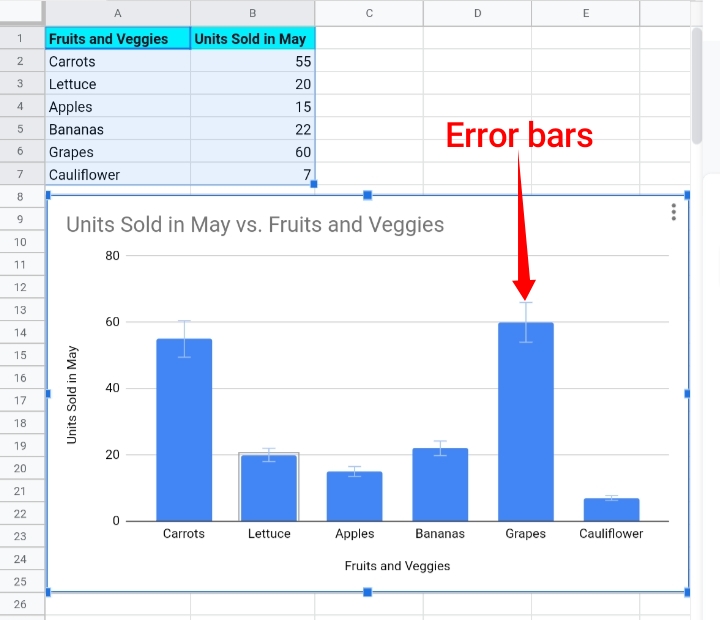
Error bars would be inserted into the column chart.
How To Customize Error Bars in Google Sheets.
Now that the error bars are inserted into the chart, you can customize the type of error bars and the value each error bar represents.
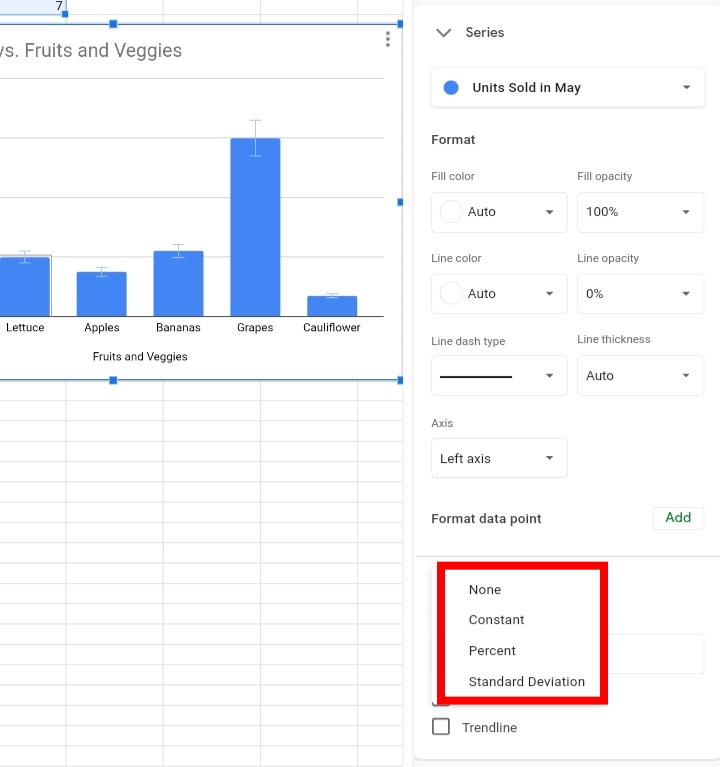
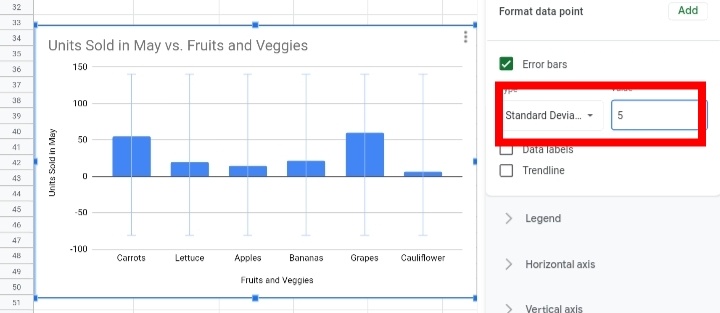
Step 1: Go to the Type section under Series, to customize the type of error bar you want to insert in your chart.
Step 2: From the dropdown list displayed, you can select any of the error bar types which are Standard Deviation, Constant, and Percent.
Step 3: In the Value section, you can add the value to the error bars. Input the value into the Value textbox.
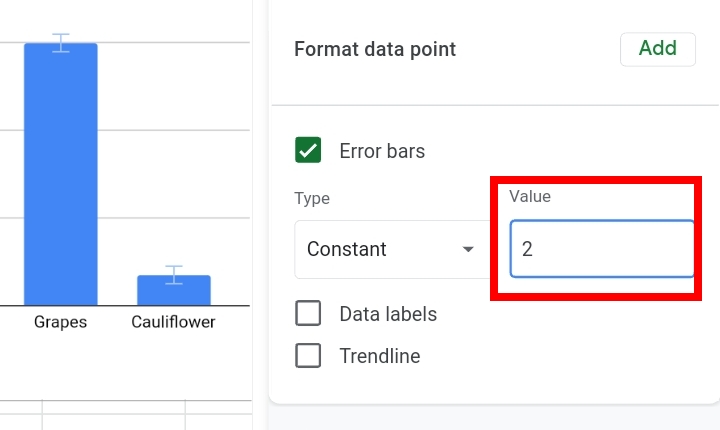
Step 4: Error bars are added to the column chart and they display the type and value assigned to them.
Types of Error Bars in Google Sheets.
In the previous section, I mentioned the types of error bars as Standard Deviation, Percent, and Constant but I’m pretty sure you don’t understand what these types are and what they do. In this segment, I’ll explain these terms in detail.
Constant.
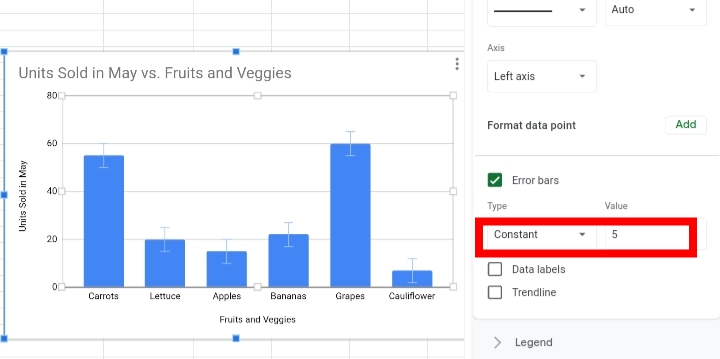
As the name implies, the value would be made a constant error bar. It won’t be changed across the column chart. If the constant is set as 5, it would be placed as -5 and +5 in the chart.
Standard Deviation.
The Standard Deviation type is placed in the middle of the column chart. It illustrates how the data is scattered around the mean value in the dataset.
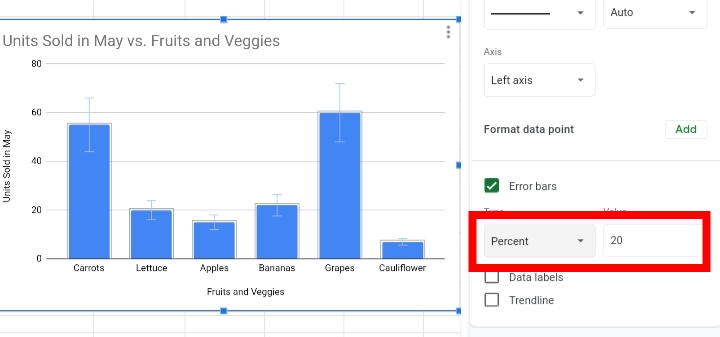
Percent.
The Percent error bars display the upper and lower difference of the data in the column chart according to the percentage value entered.
For example, if you enter the percentage value as 20%, the error bar would be placed between 80% and 120% of the dataset.
Final Thoughts.
If you are a Google Sheets user that mostly specializes in graphical representations of data, be sure to learn this feature to increase interpretation and understanding in the analysis of your data.
Now you know How To Add Error Bars In Google Sheets. I hope you found this article helpful.


