Data visualizations can help you see a bigger picture and obtain a deeper understanding of your data.
With the help of Google Sheets, we can use its powerful tools to create better visualization tools like charts, graphs and maps, that will help you find the relationship between your data, thus analyzing your data more efficiently.
In this tutorial, we’ll learn how to make and customize a histogram using Google Sheets.
What is a Histogram?
A histogram is a graphical representation of statistical information, describing the distribution of data and the frequency of the data.
It is a representation of a range of outcomes into columns formation along the x-axis. in the same histogram, the number count or multiple occurrences in the data for each column is represented by the y-axis.
It sorts data into “buckets” or “rectangles” of similar data. For example, If we have the grades of 500 students in an exam, we can bucket and the number of students scoring in the 30-40 marks bucket, the number of students scoring in the 50-60 marks bucket and so on.
How to Create a Histogram in Google Sheets?
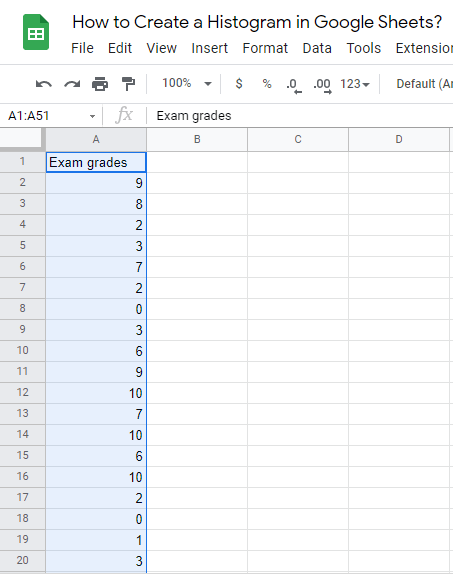
Before we start creating the histogram, we have to make a set of data first, in our example here we have the grades of 50 students in a 10 mark exam.
1. Highlight the data you want in the histogram, including the column title.
So, the highlighted cell range will be (A1:A51).
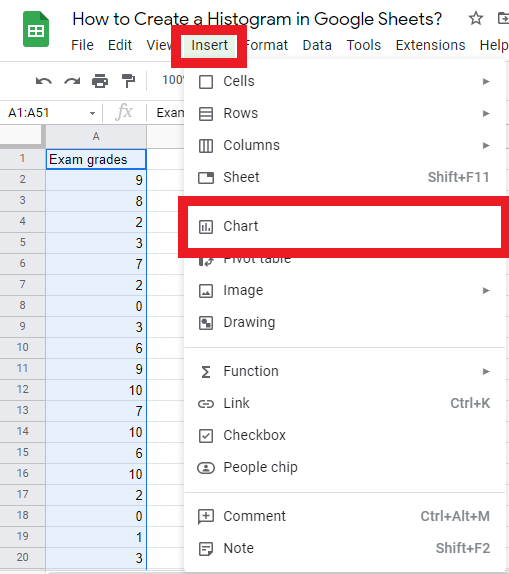
2. From the menu bar, click on “Insert”, then “Chart”.
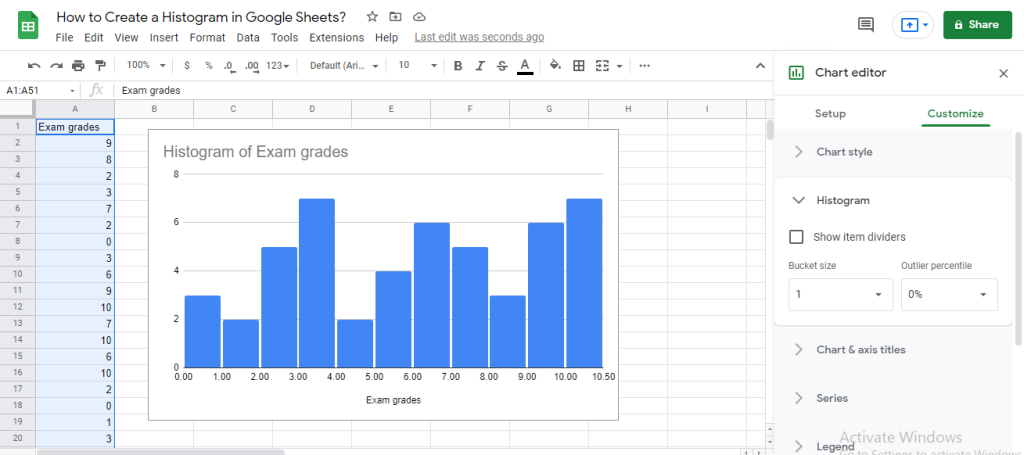
3. Google Sheets will show the chart and the chart editor on the right side of the screen where you can choose the chart type. Google Sheets automatically choose the Histogram Chart by default, but If it didn’t choose the histogram chart, you can choose it easily from the Chart editor.
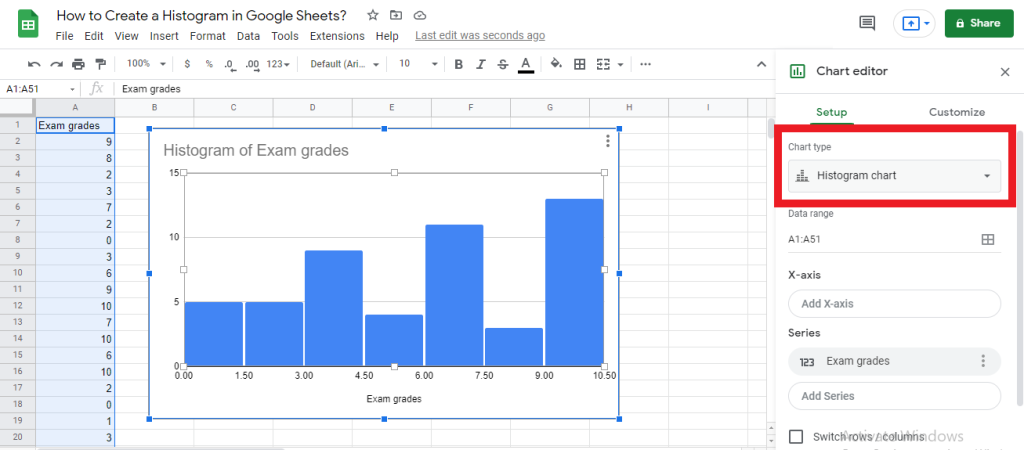
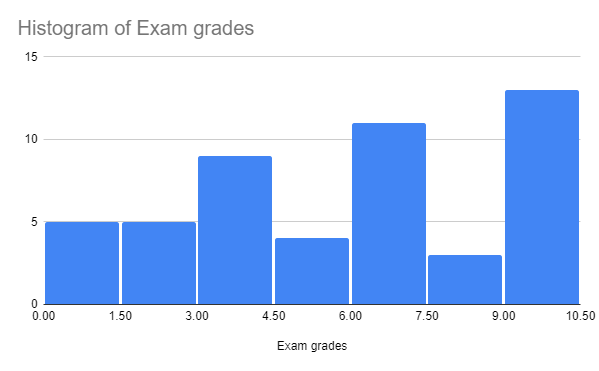
4. You have now the exam grades distributed in the histogram.
Check out How To Count Unique Values In Google Sheets.
How Do You Change the Interval on a Histogram in Google Sheets?
1. Click on the Chart editor.
2. Click on Customize option, then Histogram.
3. Adjust the intervals from the Bucket size option. You can see here that the bucket sizes and the interval between the grades are changed.
Check out How To Create A Loan Amortization Schedule In Google Sheets.
How to Customize the Histogram in Google Sheets?
Now you can make a histogram in Google Sheets, so we’ll learn how to edit and customize the histogram.
There are many options in Google Sheets that can help you customize the histogram you’ve created.
Customize Tab in Chart Editor:
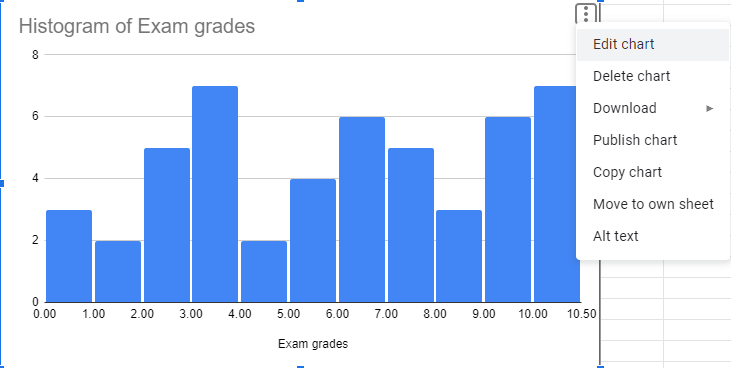
1. Click on the histogram.
2. Click on the three-doted menu in the top right corner of the histogram.
3. Choose the Edit Chart option.
Or you can do the following steps:
Click on the Chart Editor, then click on Customize tab, with the same steps as mentioned before.
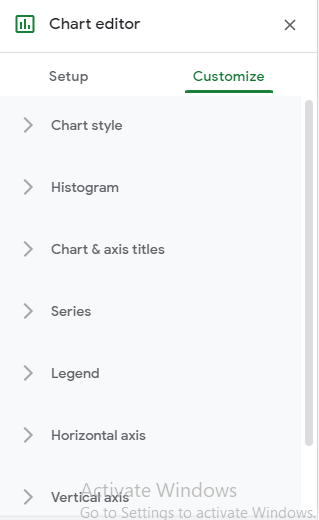
Here, you can see many options that you can edit and customize in the histogram, we’ll talk about them in more detail.
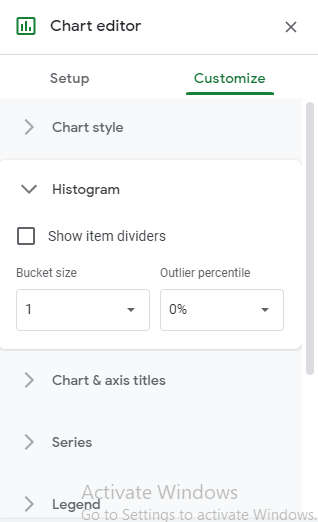
Histogram Settings:
You can find 3 powerful tools that can help you customize your histogram:
- Show item dividers: This is a checkbox that can add a line between each part in the histogram. It helps give better visualization to the distribution.
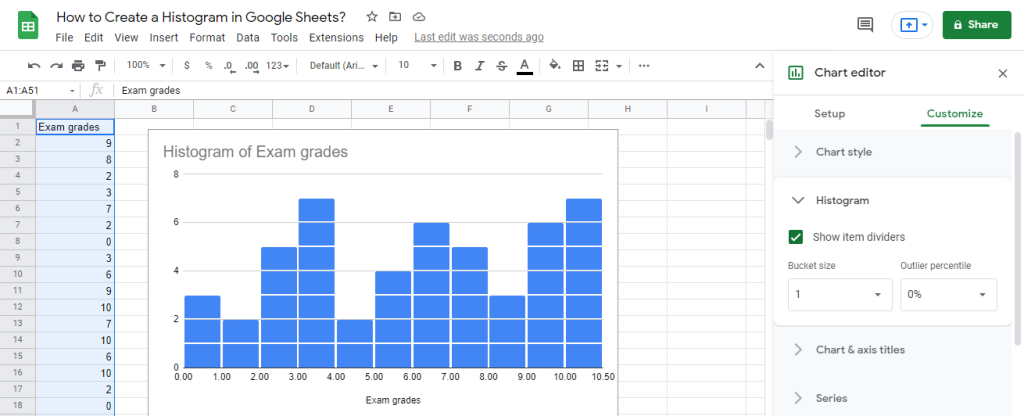
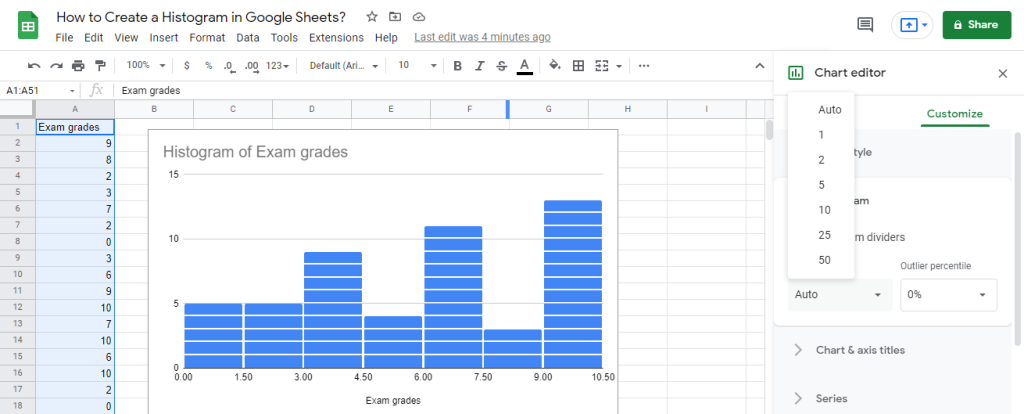
- Bucket size: You can choose between many sizes of the buckets from 1, 2, 5, 10, 25 or 50. Google Sheets choose auto bucket size by default.
- Outlier percentage: Using this option will gather data outliers with the closest relevant bucket.
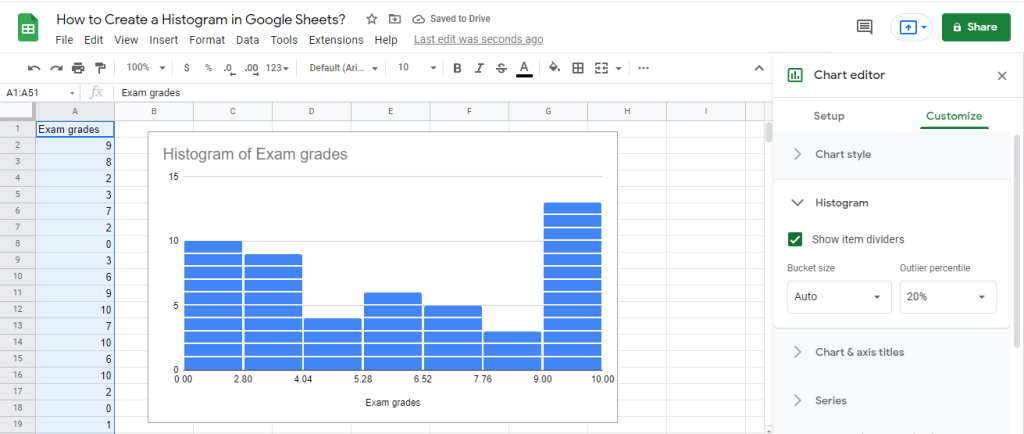
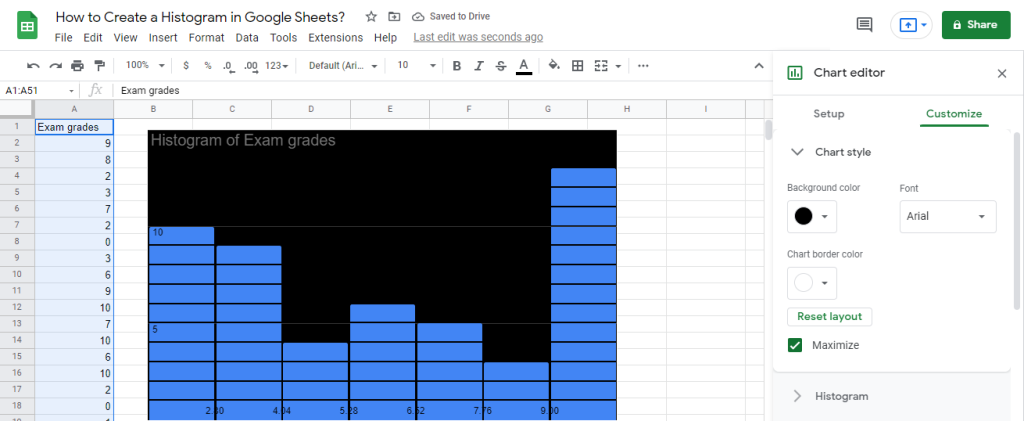
Chart Style:
It is the first option under the Customize tab, where there are 3 tools that you can use to customize the histogram:
- Background colour.
- Font.
- Chat border colour.
Horizontal and Vertical Axis:
In this option, you can change the range of your histogram by editing the min and max values, you can only display data within a specified range.
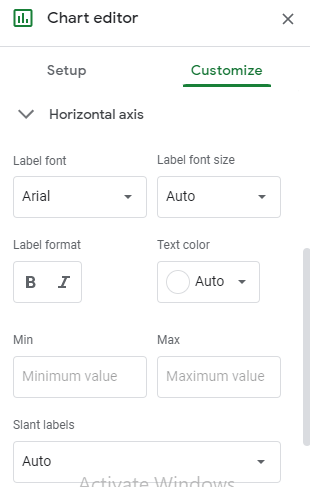
There are many other options you can adjust:
- Label font: You can change the font of the horizontal or vertical axes.
- Label font size: You can change the font size of the horizontal or vertical axes.
- Label format: You can change the format of the font, either bold or italic.
- Text colour: You can change the colour of the text in the horizontal for vertical axes.
- Slant labels: You can display the axis labels at a particular angle.
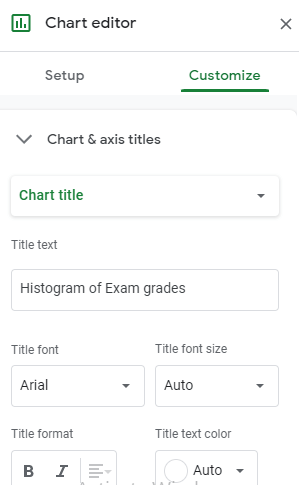
Chart & Axis Titles:
This submenu can help change the display of the chart title, chart subtitle, horizontal axis title and vertical axis title.
You can change any of the following options:
- Title text: This option changes the text displayed in the title.
- Title font: This option changes the type of the font.
- Title font size: This option changes the size of the font.
- Title format: This option changes the format of the font, bold, italic or the alignment of the text.
- Title text colour: This option changes the colour of the text:
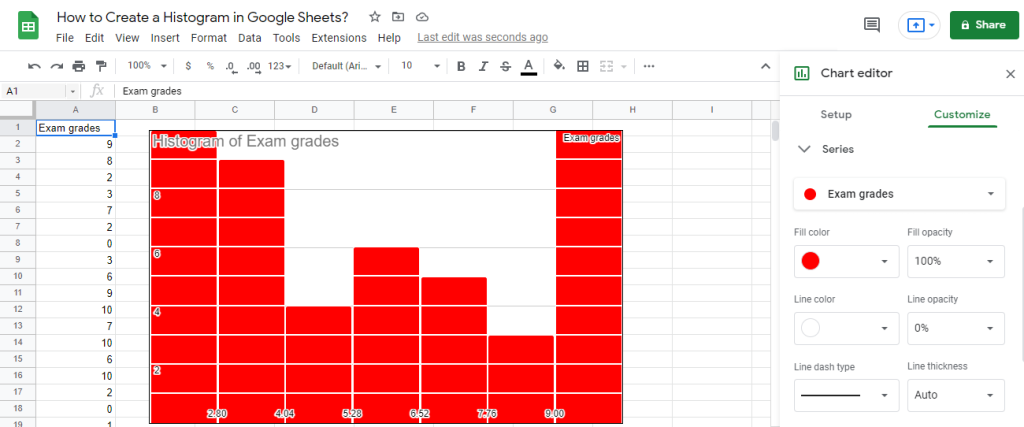
Series:
In this option, you can change the colour of the buckets. This can be an extremely important feature if you’re comparing between two items, you can give each item a colour.
For our example here, we’ll change the colour of the buckets into the red.
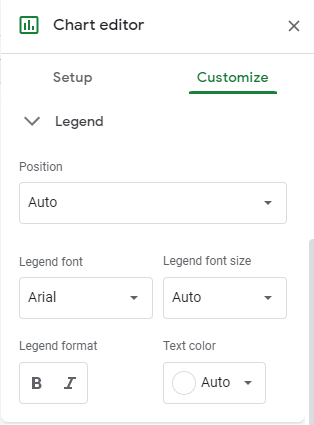
Legend:
This option let you make adjustments to the legend of the histogram, In our example, we don’t have a legend because we only have one variable, so we’ll set it to none.
The options we can adjust are the position of the legend, legend font, legend font size, legend format and text colour.
Gridlines and ticks:
In this option, you can set the histogram to have major gridlines and minor grid lines, and the colours of these lines.
You can also set the major and minor ticks on the horizontal or the vertical axis of the histogram.
Check out How To Add Or Remove Dollar Signs In Google Sheets.
The bottom line:
In this tutorial, we learned how to create and customize a histogram in Google Sheets, which gave us a bigger picture of how important to have a visualization of your data.


