What is a slope?
As we all know in the math class, a slope or a gradient of a line is the measure of the direction and how steep the line is.
The slope of a line can be calculated from two points lying on the line, the slope formula measures change in the y-coordinate (vertical change) divided by the change in the x-coordinate (horizontal change).
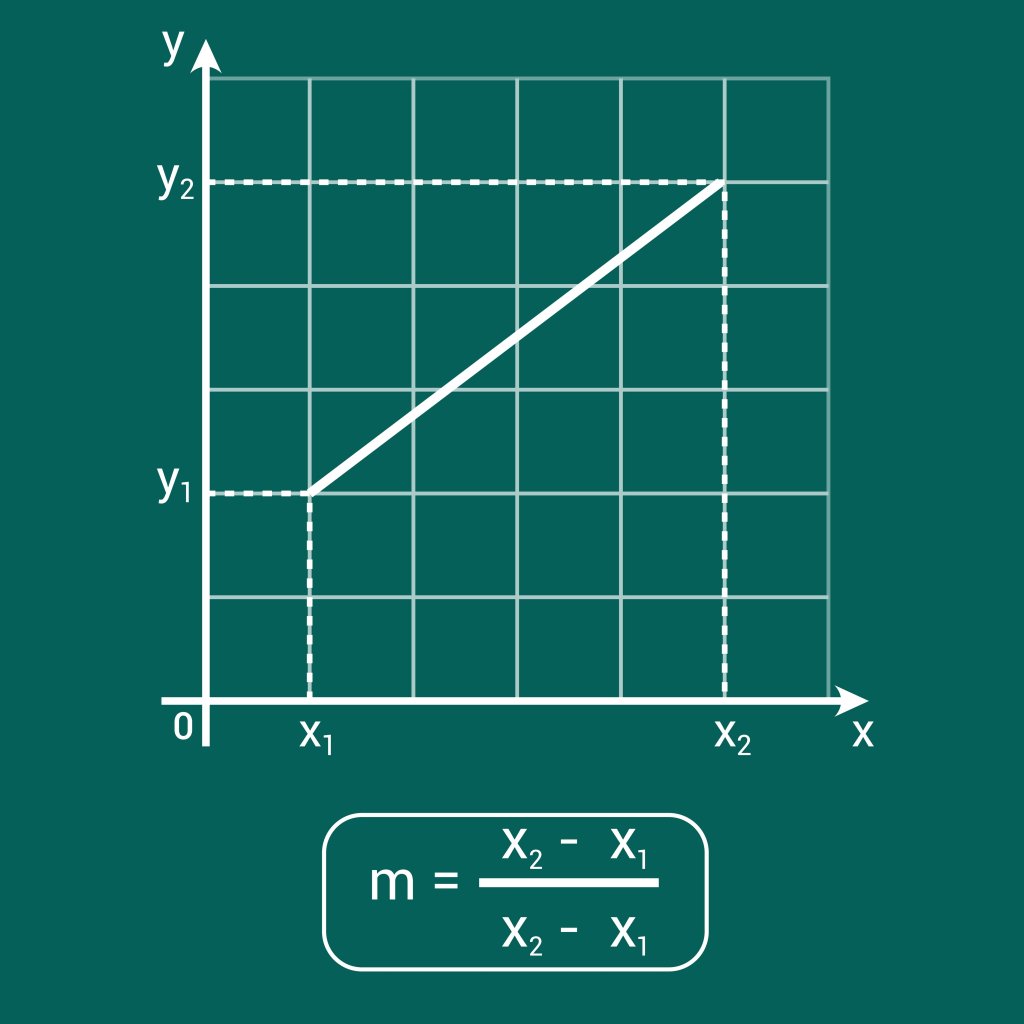
A positive sloped line is one that is trending upward from left to right, while a negative sloped line is one that is trending downward from left to right.

You don’t need to measure the slope as we all did in the math class, Google Sheets provide simple but powerful tools to can measure the slope easily.
In this tutorial, we’ll discuss how to find the slope without using charts, how to find the slope using charts and how to add an equation to a graph.
Check out How To Create A Loan Amortization Schedule In Google Sheets.
How to find the slope in Google Sheets without using charts?
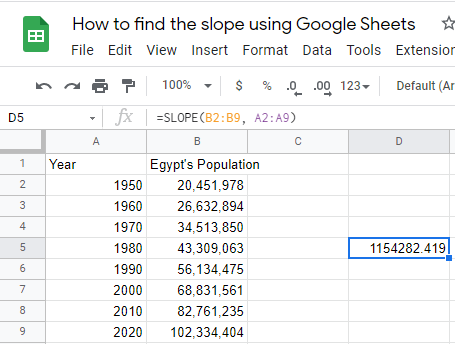
You can calculate the slope in this way in a very simple formula:
= SLOPE(data_y, data_x), we’ll replace the data of the Y-coordinate by B2:B9 and the data of the X-coordinate by A2:A9. So, the formula will be =SLOPE(B2:B9, A2:A9).
Check out How To Calculate P-Value In Google Sheets.
How to find the slope in Google Sheets using charts?
In this method, you will see the slope drawn in a chart, whether a positive or a negative chart, may be perpendicular or parallel charts as well.
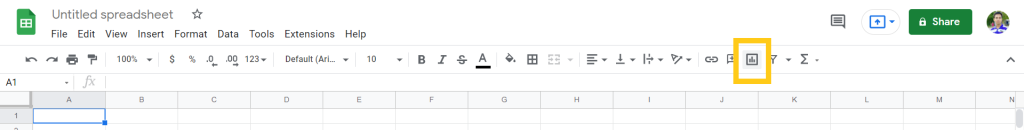
1. Click on the Insert Chart button as shown.
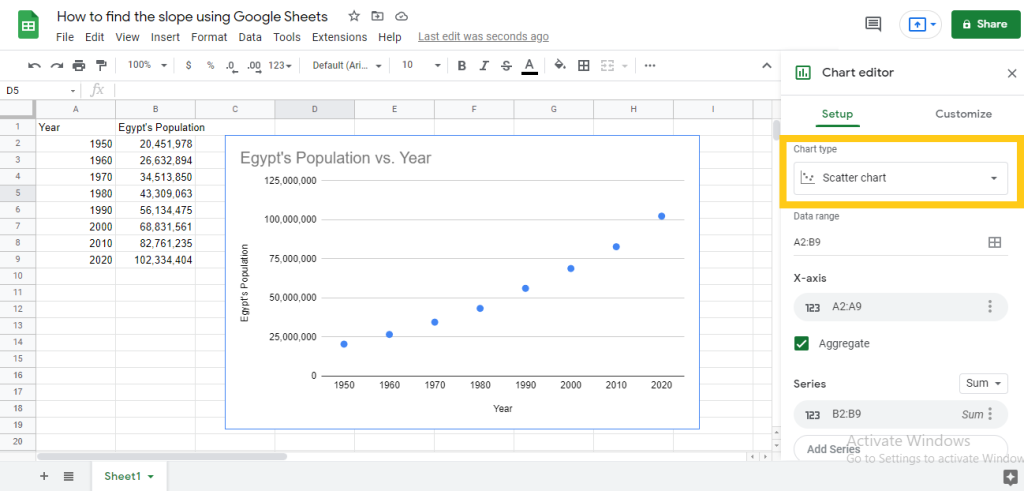
2. You’ll find a window named Chart Editor opened up, type in the Data Range B2:B9 (Y-coordinate): A2:A9 (X-coordinate).
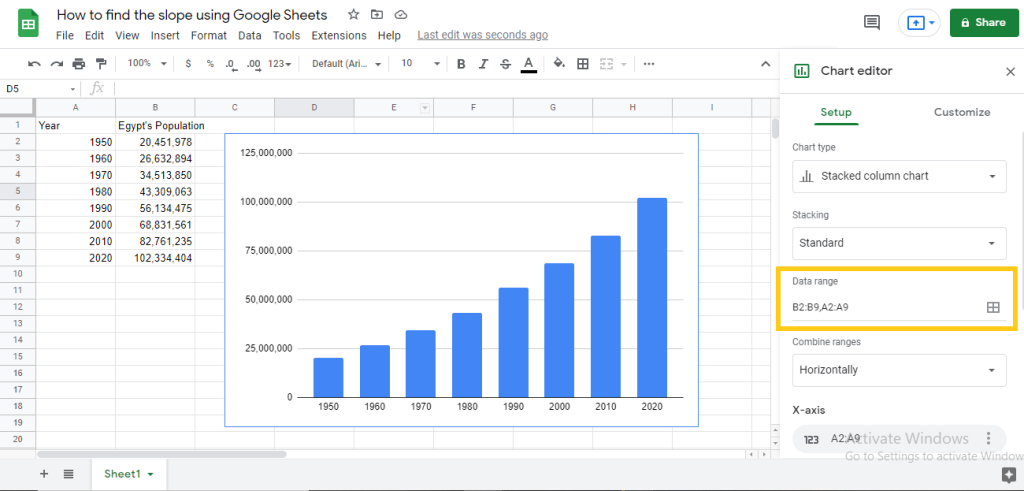
3. You can change the type of the chart, to a scatter chart for instance as in the shown example from Chart Type in Setup.
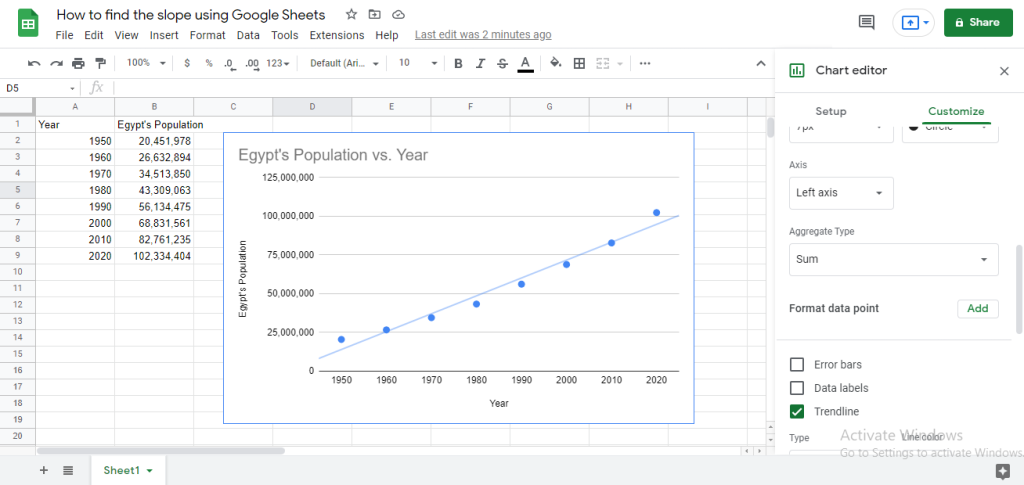
4. To know if the chart is increasing or decreasing in value, you can add a Trendline, You can add a trendline by clicking Customize, then Series and toggle Trendline button. You can see here that this is a Positive slope that is increasing, indicating that Egypt’s population is increasing.
To get the exact number of the slope from the graph, we will need to add an equation to the graph of the Trendline we drawn in the previous method, and this takes us to the final tutorial in this article.
Check out How To Count Unique Values In Google Sheets.
How to Add Equation to a Graph in Google Sheets?
1. Click on Label, then Use Equation.
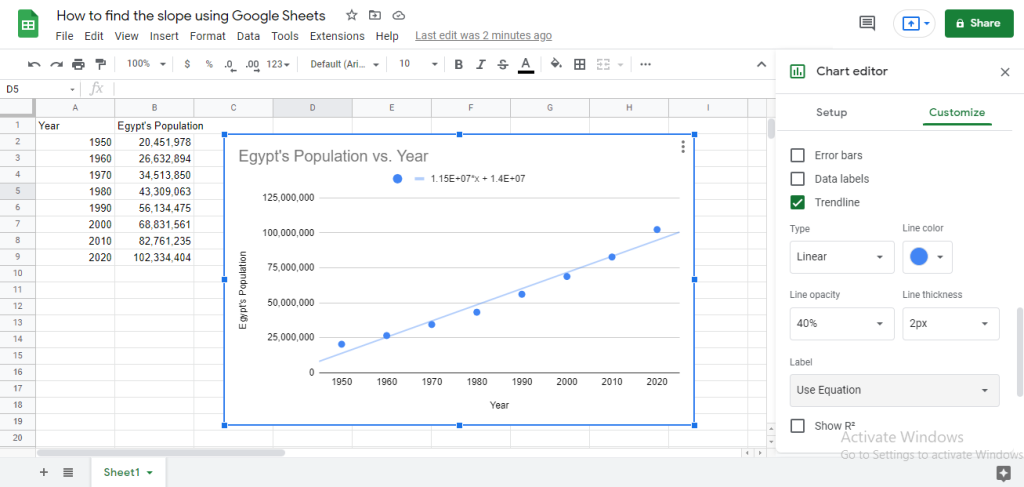
2. You will find the equation of the slope of the line written as shown in the previous picture.
Final Thoughts:
We have demonstrated many methods of getting the slope using Google Sheets, whether you want to get the precise number by typing the formula we’ve shown or by drawing the slope using charts.
Google Sheets provide very powerful tools that make it easy to perform many tasks like getting the slope.
You can use Microsoft Excel if you want, but you need to make a formula, so we recommend you to use Google Sheets as it’s way easier.


