The Confidence Interval is a statistical calculation used in determining a mean with a certain level of confidence.
For example, if you were a scientist studying the height growth of Oak trees trying to find an interval of heights upon which to base the rest of your studies, you would use the Confidence Interval to do so.
Such calculations need lists and lists of samples which can make individual calculations increasingly complicated.
This is where Google Sheets comes in, which features built-in formulas that can make calculating the Confidence Interval a simple task.
In this article, we will learn how to calculate the Confidence Interval using the t-Distribution method for samples less than 30 and the Normal Distribution method for samples equal to or more than 30.
We will learn How to Calculate the Confidence Interval in Google Sheets and other common questions regarding the Confidence Interval topic.
The Confidence Interval Formula
The Confidence Interval Formula is used in many different ways but it mainly consists of common components, and it is written as follows:
CI = x̄ +/- t*(s√n)
Let us break it down to get a better understanding of the formula components:
- CI is the Confidence Interval.
- X̄ is the Sample Mean (Average).
- t is the t-value which is the Confidence Level.
- s is the Sample Standard Variation.
- n is the Sample Size or the number of samples we have.
Now let us discuss how we are going to use this formula.
First Method: Calculating the Confidence Interval by Using the t-Distribution Formula
This method is used when the number of samples you have is less than 30 (Sample Size < 30)
To use this method, first, write your data set in a column and start calculating the Sample Mean.
1- To calculate the Sample Mean, select a blank cell below your data and use the Average Formula:
=AVERAGE(value)
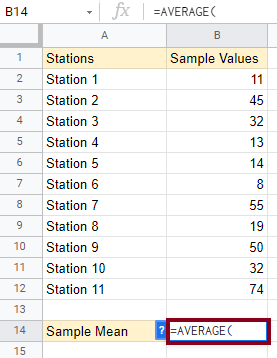
Then highlight or type in the cell locations of your data =AVERAGE(b2:b12) as follows:
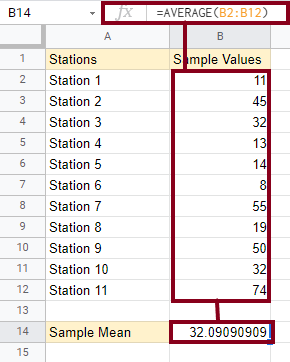
Press Enter or the Return Key to reveal your results.
2- The next step is calculating the Sample Standard Deviation which can be done using the following formula:
=STDEV.S()
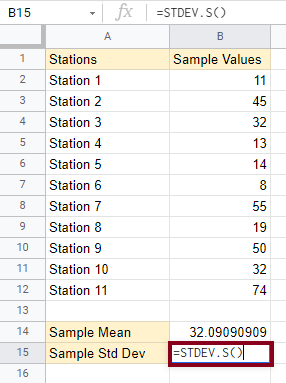
Then highlight the cells which contain your data or insert them manually as follows:
=STDEV.S(b2:b12)
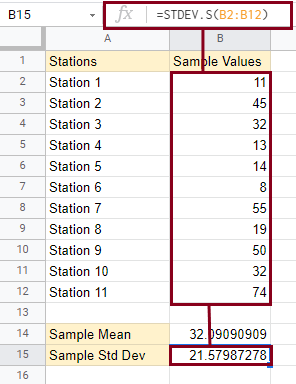
Then press Enter to reveal your results.
3- Next, you will need to calculate the Sample Size. The Sample Size is the number of values you have.
This can be done by either counting them manually if you have a smaller number of data cells or by the COUNT formula.
To use the formula, type the following in a blank cell:
=COUNT()
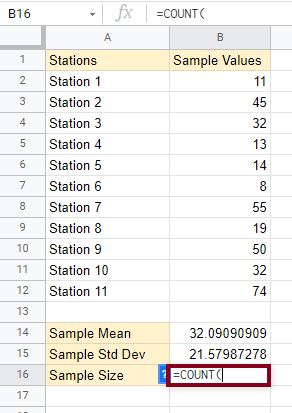
Then highlight the cells which contain your data or manually type them as follows:
=COUNT(b2:b12)
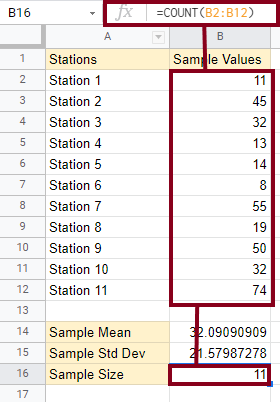
Press Enter to reveal your results.
4- Now it is time to calculate the Confidence Interval. To do this, we need to calculate the Lower and Upper bounds for a percentage that we determine.
These are the lowest and highest values in our Confidence Interval range.
4.a- First, the Lower bound of a 90% Confidence Interval, which is calculated through the following formula:
=Sample Mean – T.INV(1-0.9, Sample Size-1)*(Sample Stdev/SQRT(Sample Size))
This formula is mostly mathematical save for two inner formulas:
- =T.INV(probability, degrees_freedom) is the main component of this method.
- SQRT(value) calculates the square root of a value.
To apply the full formula according to our spreadsheet, type the following form:
=B14-TINV(1-0.9,B16-1)*(B15/SQRT(B16))
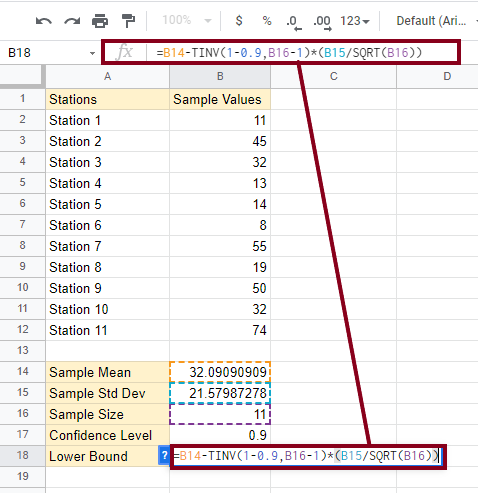
Press Enter to reveal your Lower bound results.
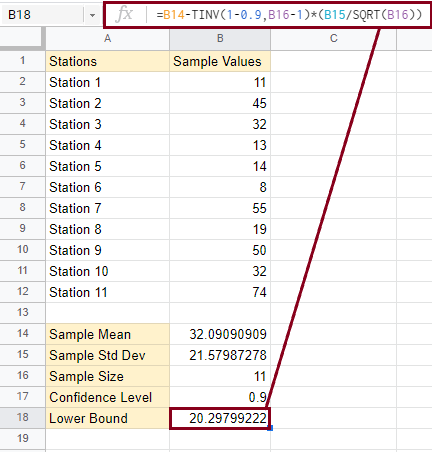
4.b- Now to get the Upper bound part of the interval, use the following formula:
=B14+TINV(1-0.9,B16-1)*(B15/SQRT(B16))
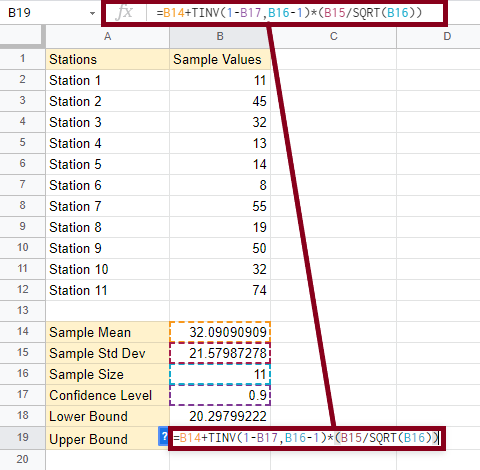
Then press Enter or the Return Key to show your Upper Bound results:
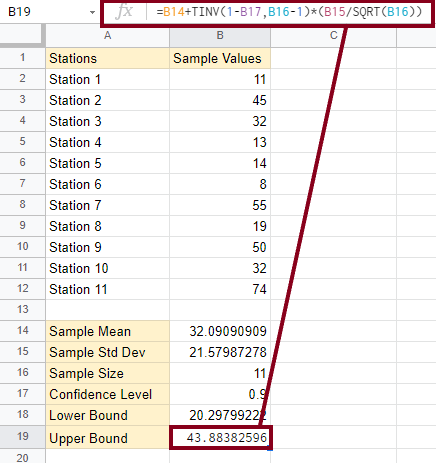
Now with both the Lower and Upper bounds, you have an interval of the Confidence Level of 90%.
Second Method: Calculating the Confidence Interval using the Normal Distribution Formula
This method is used when the number of samples you have is 30 or more (Sample Size ≥ 30). It is mainly used for larger data sets through the NORM.S.INV Function.
To apply this method, use the following formulas to find your Sample Mean, Sample Standard Deviation, and Sample Size:
- Sample Mean: =AVERAGE(value)
- Sample Standard Deviation: =Stdev.S(value)
- Sample Size: =COUNT(value)
Highlight or insert the cells that contain your data in the value segment.
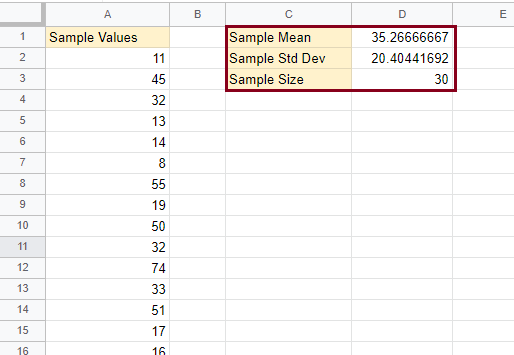
Next, calculate the Lower and Upper bounds of any Confidence Level desired. For this tutorial, we will use a 90% Confidence Level.
Using the Normal Distribution Formula as follows:
=sample mean -/+ NORM.S.INV(confidence level)*(sample stdev / SQRT(sample size))
A. The lower bound:
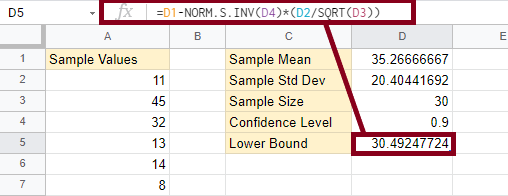
Apply the above formula to the spreadsheet sample we have in the following manner:
=D1-NORM.S.INV(D4)*(D2/SQRT(D3))
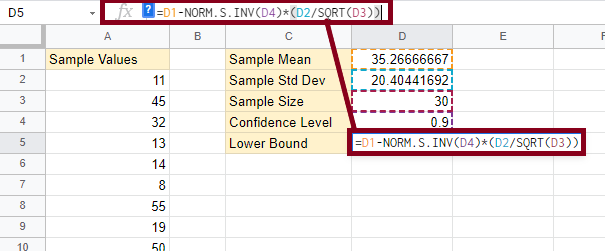
Press Enter or the Return Key to reveal your lower bound results. It should then look like this:
B. The Upper Bound:
Apply the above main formula to the spreadsheet sample we have in the following manner:
=D1+NORM.S.INV(D4)*(D2/SQRT(D3))
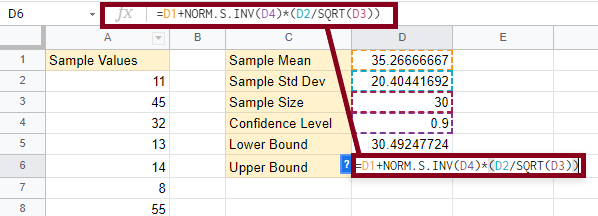
Press Enter to reveal the Upper Bound results, which should look like the following:
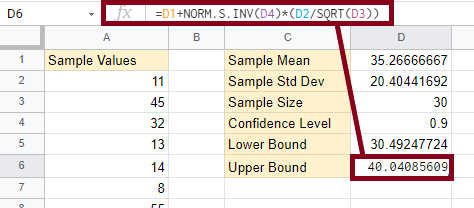
Now with both the Lower and Upper bounds, you have an interval of the Confidence Level of 90%.
Finding the 95% Confidence Interval
The confidence level determines the accuracy of the interval. In a data set of 100 values, for example, the 95% confidence value ensures that 95 times out of 100, the value will be within the resulting margin.
This leaves only a margin of 5 errors out of 100 where the value will either be higher or lower than the resulting range.
To calculate the 95% Confidence Level, or any other level (80%, 90%, or 100%), you simply need to change a specific segment of the whole formula.
– The t-Distribution formula:
=Sample Mean -/+ T.INV(1-confidence level, Sample Size-1)*(Sample Stdev/SQRT(Sample Size))
– The Normal Distribution Formula:
=sample mean -/+ NORM.S.INV(confidence level)*(sample stdev / SQRT(sample size))
By changing the highlighted (heavy) part, you have complete control of the confidence level you want, by simply writing it in its corresponding value in decimal form.
Extra Help and Tips
Finding the Z score
The Z score is standard and doesn’t change, but since Z scores are numerous, they can hardly be remembered. A quick way to solve this is by finding the Z score through the following formula:
Sample mean (x) +/- Z value (confidence value) * (Sample Standard Deviation (S) / √Sample Size (n))
Calculating the CI
The Confidence Interval is calculated by the CI formula:
CI = x̄ +/- t*(s√n)
To find these values, divide the sum of all your data values by the number of samples you have to find the Mean Sample x̄.
Use the Sample mean (x) +/- Z value (confidence value) * (Sample Standard Deviation (S) / √Sample Size (n)) formula to find the Z score.
Use the STDEV.S Function to find the Sample Standard Deviation.
Fill the following formula with your results: =Sample Mean -/+ TINV(1-confidence value, (Sample Size)-1)*STDEV/SQRT(Sample Size).
By applying subtraction once, and applying addition once, you now have an interval that acts as your CI.
The Sample Size in Confidence Intervals
The Sample Size is the number of Samples you have. A spreadsheet of 30 cells containing data is a spreadsheet with a Sample Size of 30.
You can find your Sample Size in Google Sheets by using the COUNT(value) Function and highlighting all of your cells or by manually typing them in.
Calculating the Confidence Interval for two proportions
We have learned how to calculate the Confidence Interval for one data set, but what if we want to compare more than one data set to each other?
This could simply be achieved through the following formula:
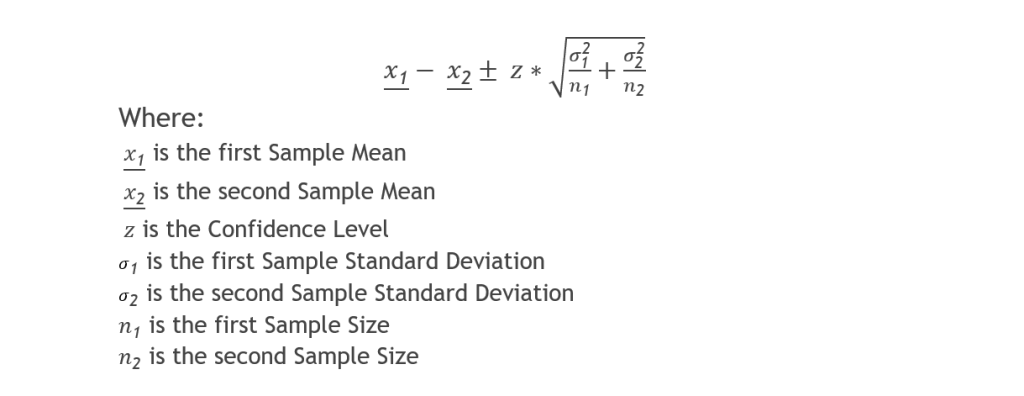
- First, apply the formula using the subtraction (-) calculation to get the Lower bound and the first part of the interval.
- Then apply the formula using the addition (+) calculation to the Upper bound and the second part of the interval.
Conclusion
To sum up, this article discussed the Confidence Interval and its various calculations in Google Sheets. We learned two methods to apply the CI formula according to the number of values in a data set, (t-Distribution for values less than 30, and Normal Distribution for values of 30 and more).
We introduced functions and calculations for finding Sample Means, Sample Standard Deviations, and Sample Sizes.
We discussed the z score, which is also called the Confidence Level, how to find it and how to calculate it.
We also explained how to calculate the Confidence Interval with two proportions, went over the formula, and broke it down into simple terms.
Hoping this article was helpful, educative, and easy to follow.


